Calgary Real Estate: 10 Months In Review
I think there is a definite “bump” (re: improvement) in this months Real Estate data. Is this due to increased activity resulting from the Mortgage rule changes? Or is this a new trend? Continue visiting my blog to analyze future data.
Breaking down the following statistics helps you anticipate near term market movements:
- Sales to new listings ratio.
- Absorption rate.
- Average price.
Please continue sharing this information with those you think might find it interesting. Email this link OR click the “Like” button above. Thank you!
Calgary Single Family Home Data
Sales To New Listings Ratio:
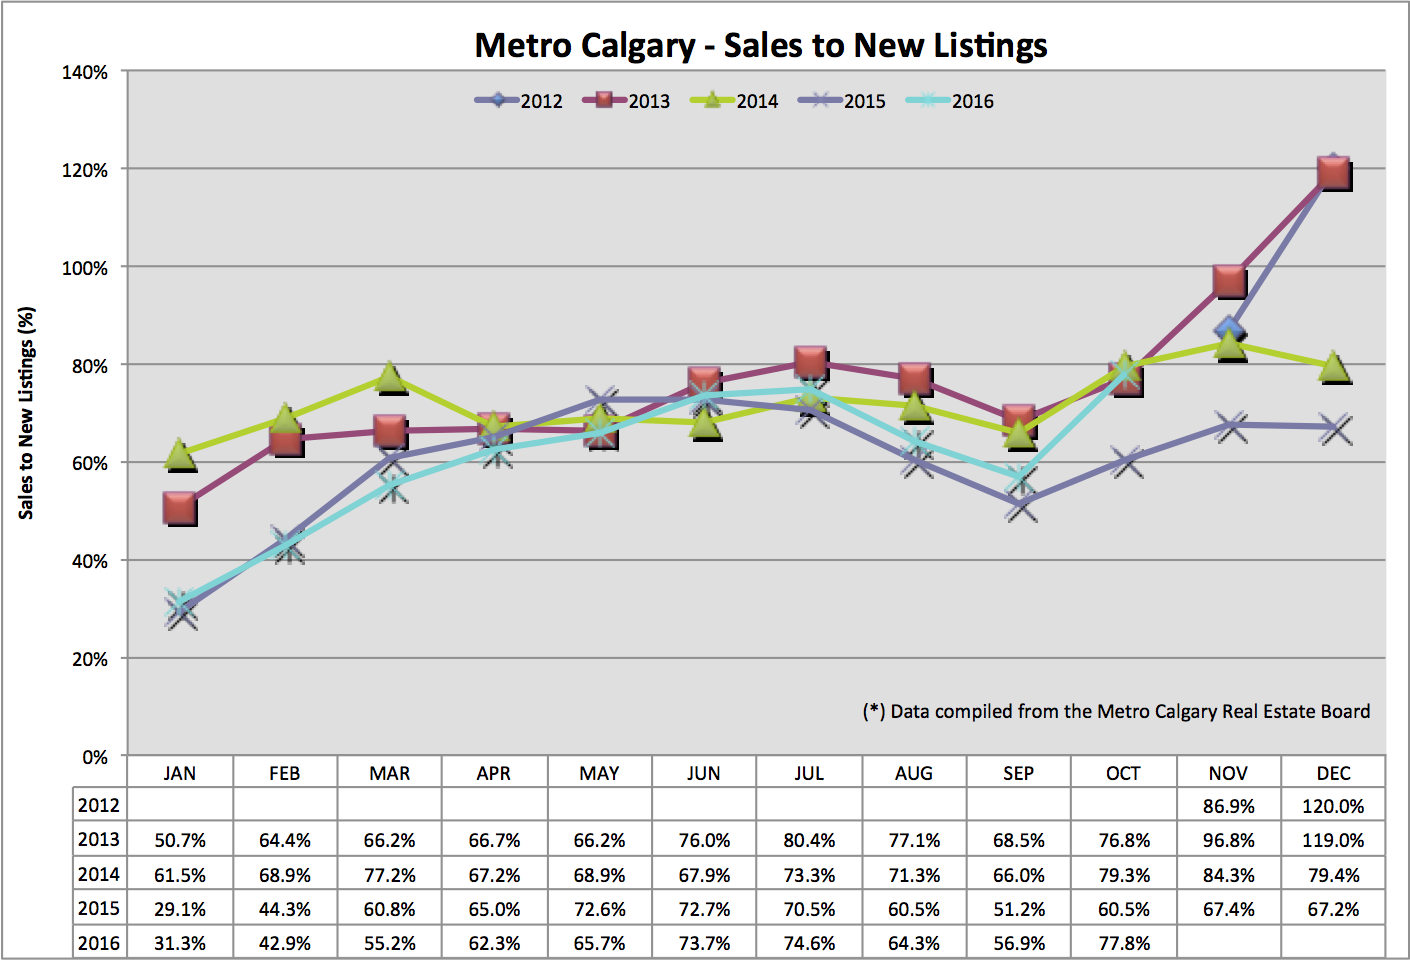
This ratio tells us how many new listings (new homes for sale) are coming onto the market NET of homes sold (leaving the market). Understanding this ratio helps anticipate near term listing inventory.
You will see the teal line (2016) significantly increase in October. An increasing sale-to-new-listings ratio means more homes are selling, with less coming online for sale (improvement).
You will also see how closely 2016 was following 2015, setting a great trend line for the remainder of 2016. I think the bullish spike in this ratio is a result of the Mortgage rule changes.
Absorption Rate:
This data point helps determine the relationship between current sales and listing inventory. This data point tells us in months, how long it would take to liquidate ALL of the listing inventory currently for sale, at the pace of this months sales volume.
Traditionally, for context, between 2-4 months absorption rate is a “balanced market”. Higher absorption rates typically equate to down pressure on pricing. The opposite is true for low absorption rates.
You will see below October 2016 absorption rate is 2.5 months (down = improvement). Again, we were trending slightly lower than 2015 with the recent decrease attributable to the Mortgage rule changes. Look for a continuance of this trend line to finish of 2016, unless the market is still propped up because of the Mortgage rule changes.
Average Price:
The average price allows us a comparison of month over month and year over year price trends. Please take each month with a “grain of salt”.
Here’s why …
Due to Mortgage rule changes, the price range of $300 – $400K single detached homes saw the greatest number of sales. I think this skews the average price data lower. Similarly, I think higher priced homes skewed the average price higher in September 2016.
Again, I think stepping back, considering secondary data and holistic market movements, in addition to actual data points, help me get what I want… a sense of the direction of Calgary Real Estate.
Calgary Apartment Data
Calgary apartments offer smaller amounts of data to analyze. I think this creates more erratic data points that I look at from a wide angle. Instead of focusing on isolated month over month or year over year data, I look at general trend lines with context.
Sales To New Listings:
I think a spike in this data point can be attributable to the change in Mortgage rules. This rise in sales-to-new-listings is an improvement.
Absorption Rate:
Everything is aligning to ebb and flow with the announcement of the most recent Mortgage rule change: decreasing absorption rate month over month. This nearly equals our absorption rate from last year.
Median Price:
I think the spike in median condo prices in October is due to increased volume of lower priced condos selling before Mortgage rules took effect.
Conclusion:
Certainly, I think this months data is interesting to interpret. I think intuitively the changes in month over month and year over year data were coming due to recent Mortgage rules.
I think long term fundamentals eventually prevail. Continue to look for signs of increasing population, decreasing unemployment rates and decreasing supply BEFORE there is a steady increase to Calgary Real Estate pricing.
That said, I have been exposed to the thinking that doing the opposite of the general market sentiment (selling when everyone is buying and buying when everyone is selling) pays off long term.
However, I think the intestinal fortitude to execute on a large ticket Real Estate purchase, going against the grain of popular market thought, is rare.
Thank you in advance for clicking the Facebook “Like” button above and/or emailing a link to this content to those whom you might think will find this interesting.
Cheers,
Chad Moore
P.S
If you are considering entering the Real Estate market in the next 6-12 months, consider starting your Mortgage pre-approval today so you can narrow your home search, understanding your home affordability.
==> Click here to begin <==
Recent Posts
Calgary Market Update—March 2025 Data
Here are some Calgary Real Estate numbers, across all property types, out of the gate for…
Interest Rates Up Or Down?
Hey Guys! Tariffs are here. Now what? Tiff Macklem, governor of the Bank of Canada, gave…
Bank of Canada Hot Mic Moment
Hey Guys! The Bank of Canada publishes "meeting deliberation notes" relating to the discussion of raising,…
Banker’s Damaging Admission
When the governor of the Bank of Canada speaks, we listen! Tiff Macklem, governor at…
January 2025 Market Stats
Let's look back at January 2025 Calgary Real Estate Board (CREB) data to make sense…
Mortgage Interest Rate Review
Hey Guys! Here's an example of how the Bank of Canada is in a balance…


