As your Calgary Mortgage authority expert, I am differentiating myself by actually helping you BEFORE you become a client of mine.
When you have a question, Real Estate or Mortgage need, I want you to think of me first. Send me an email, text or call.
That said; let’s understand some important data to help you ANTICIPATE future home prices in Calgary.
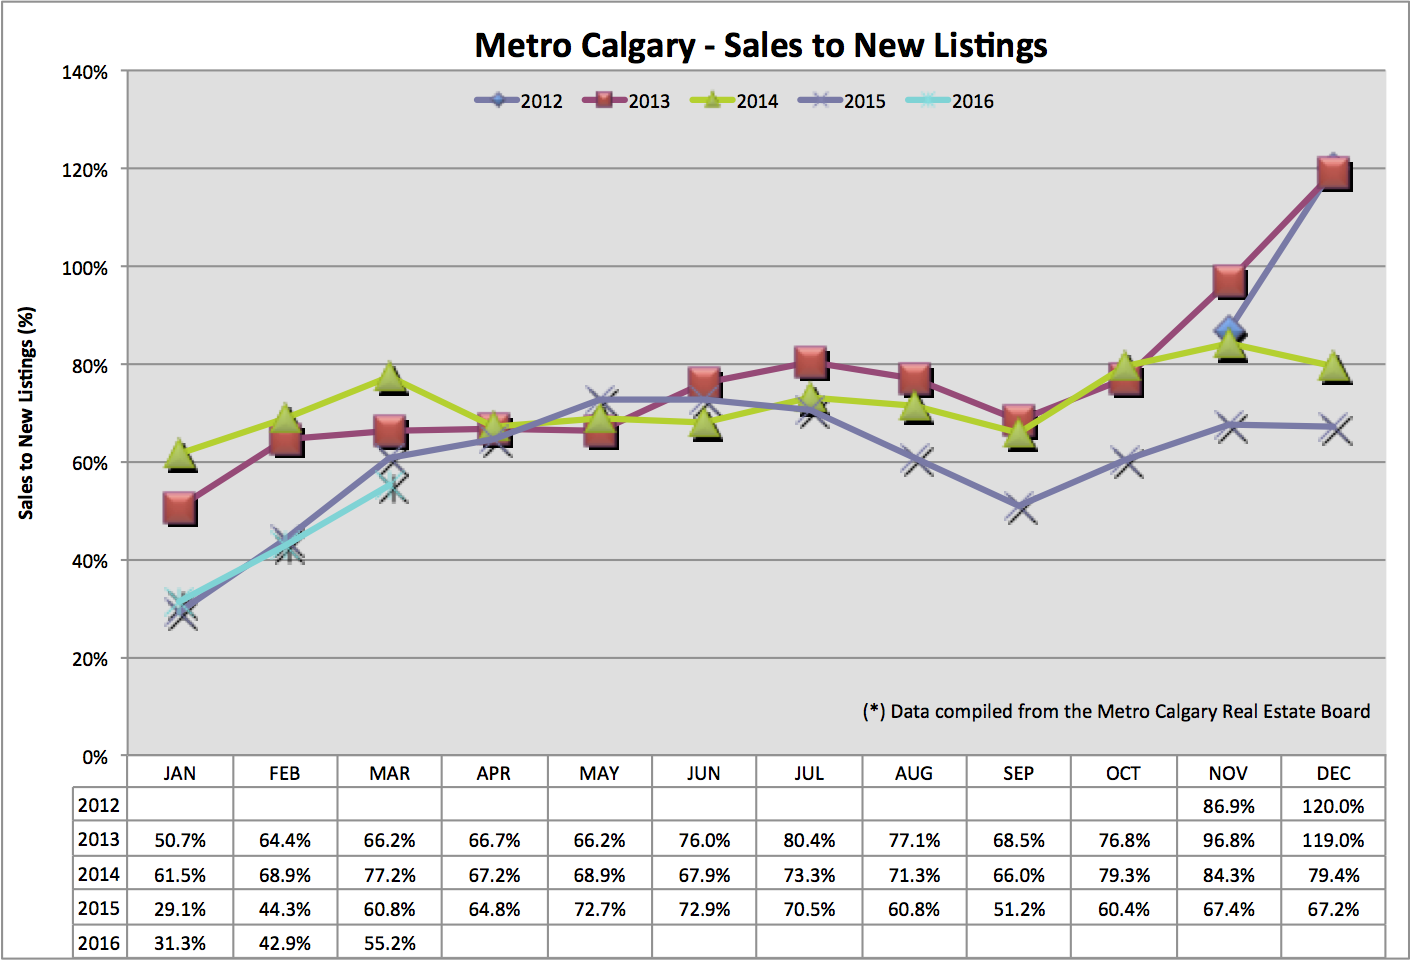
Sales To New Listings Ratio:
The sales to listings ratio helps us anticipate future listing inventory. This is important because it offers some insight to one half of the supply and demand curve. Supply and demand is very influential in future pricing. March 2016’s sales to new listings ratio is 55%. For context, 100% sales to new listings ratio means for every home sold, a home is listed for sale. The lower this ratio is, we can anticipate more listing inventory for sale. March 2016 we see this ratio increasing, month over month, and slightly down year over year.
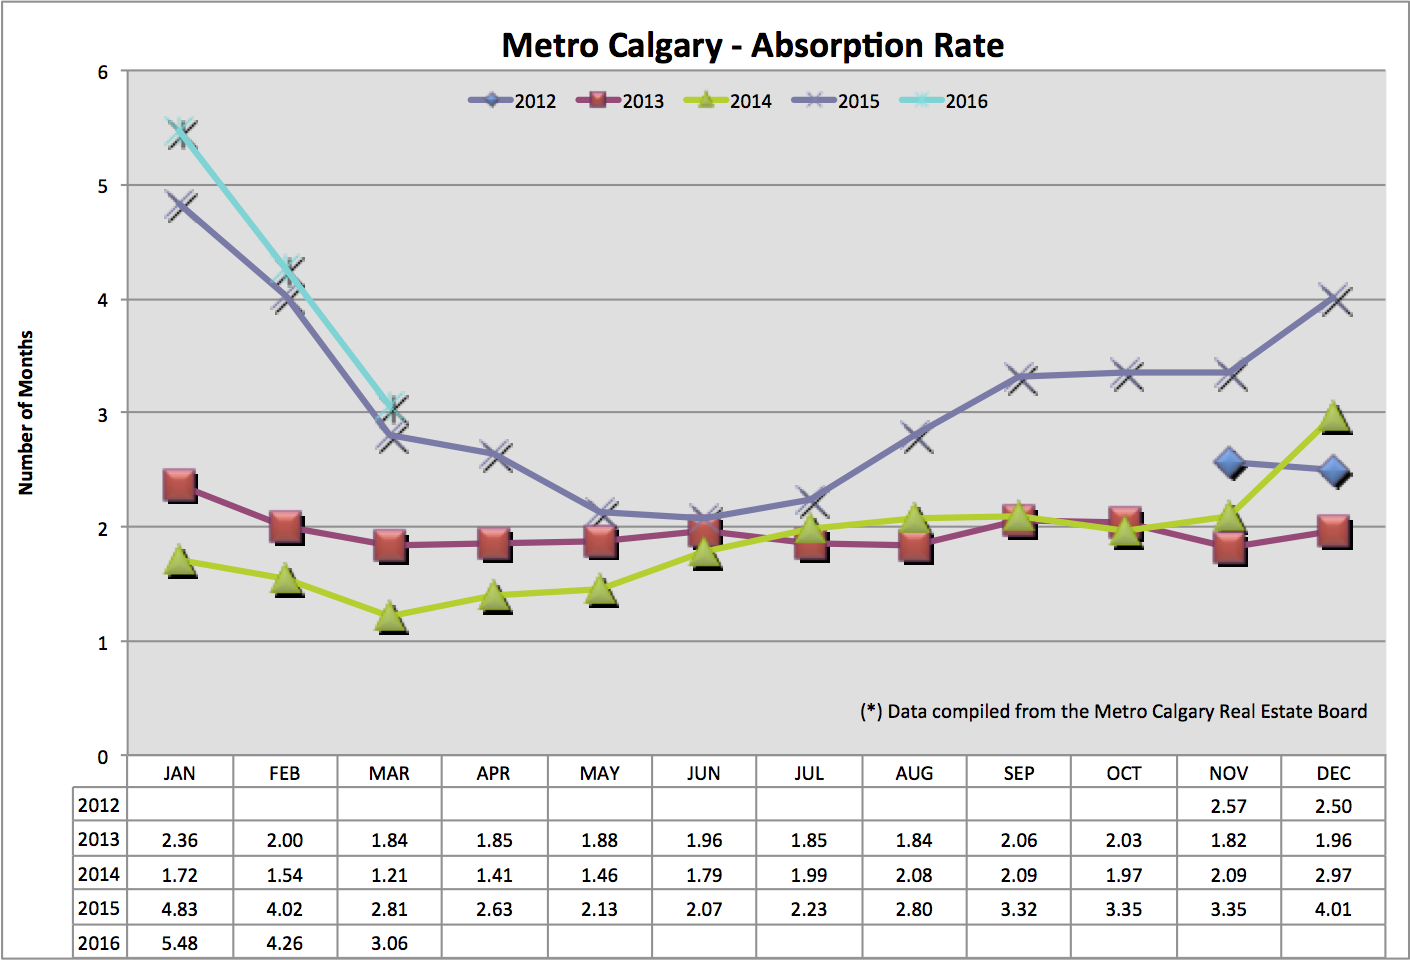
Absorption Rate:
The absorption rate tells us in months, how long it would take to liquidate ALL of Calgary’s detached single-family homes for sale. This helps us understand the relationship to the number of homes for sale and the volume of home sales. Traditionally, a balanced market is between 2-4 months. Month over month this ratio is down significantly. And year over year, the ratio is about the same (slightly higher).
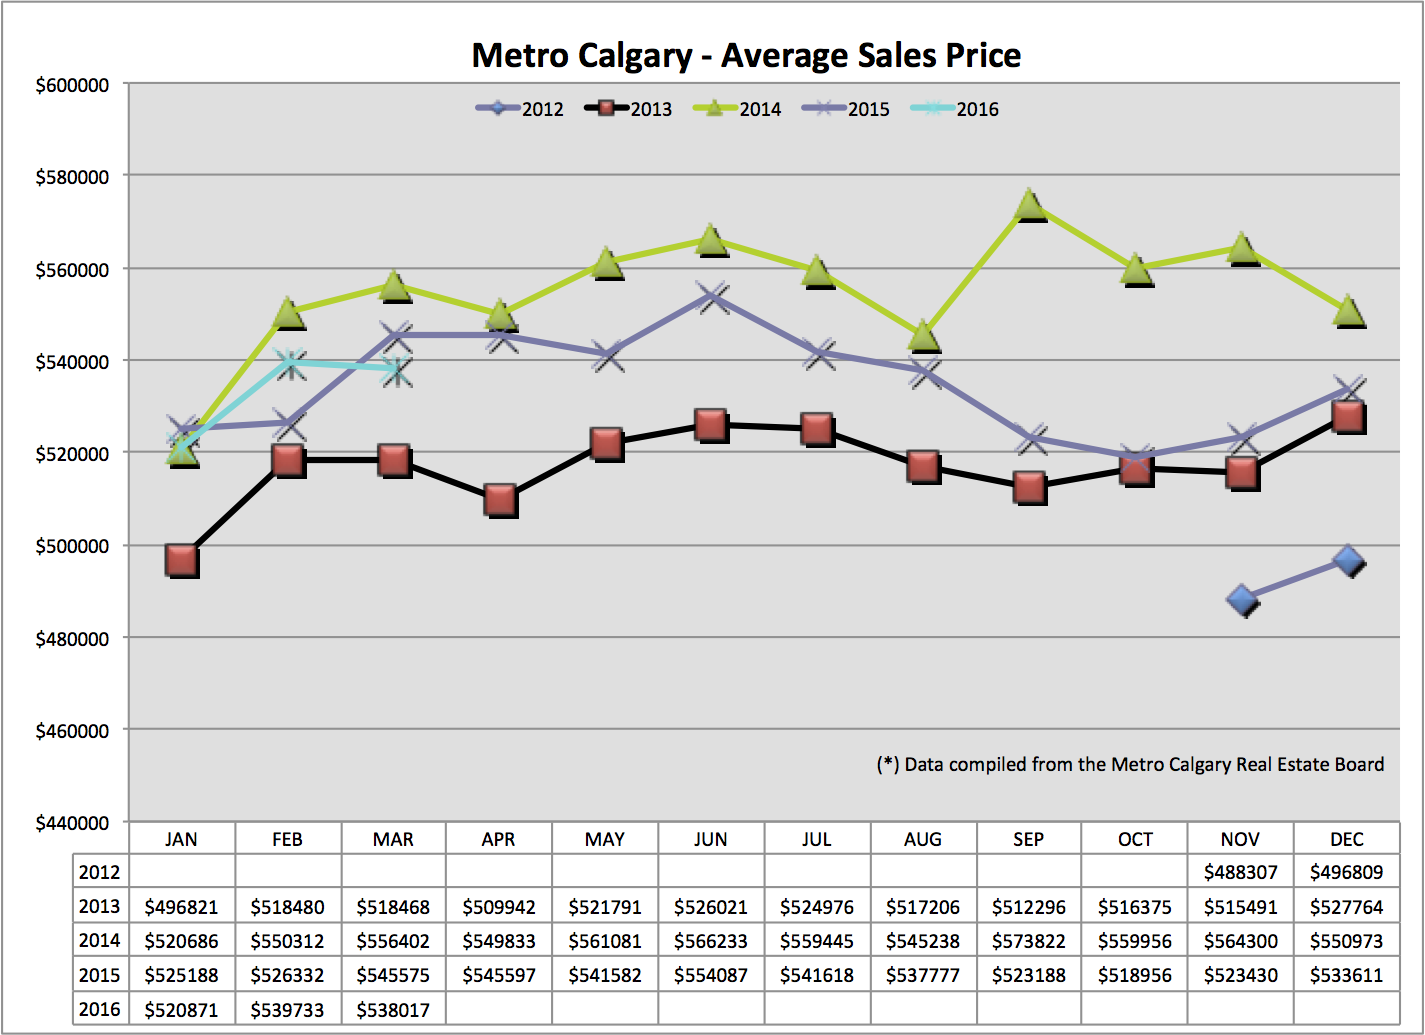
Average Sale Price:
The average price helps us get an understanding of the macro movements of Calgary’s detached housing market. Remember, each micro area of Calgary might behave differently than the macro picture. March’s average home price slightly down month over month and year over year. However, if you remember from February 2016, the average price was skewed up due to higher than normal amount of million dollar homes sold.
Forecast:
I am noticing a VERY similar trend line, in all three of our Calgary Real Estate data points, compared to the first three months of 2015. Based on our most recent data, I see no reason for this trend to discontinue for the next quarter of 2016. We are tracking toward a very similar year to 2015.
IMPORTANT: One “fear” in the market is for everyone who has been laid off from work, and when their severance packages run out, are there going to be people who NEED to fire sale their homes, re-adjusting market prices lower. And if this is true, by how much?? I am eagerly looking for indicators of this beginning to happen, which today, is not.
Thanks for reading!
Chad Moore
P.S
If you like this content, let me know by clicking the “Like” button at the top. Or, share my Facebook post with others who might appreciate this content.
Thanks in advance.