Use the information below to:
- Help you anticipate near term Single Family Home (SFH) and Apartment price movements.
- Anticipate near term fixed interest rate movements.
- Help you decide WHO you choose to have the privilege of placing your Mortgage (shameless self promotion here :-)).
I don’t make the rules of Supply & Demand economics; I just do my best to understand them.
In a nutshell, I apply these principles of supply and demand to help guide my understanding of near (and long term) Real Estate market movements:
- Increasing supply and decreasing demand put downward pressure on pricing.
- Decreasing supply and increasing demand put upward pressure on pricing.
Demand for housing can be found in several different areas: net migration of people moving to Calgary, unemployment rate and consumer confidence in future employment. Supply of Real Estate can be found in the graphical information below.
Single Family Home Review (Detached Homes)
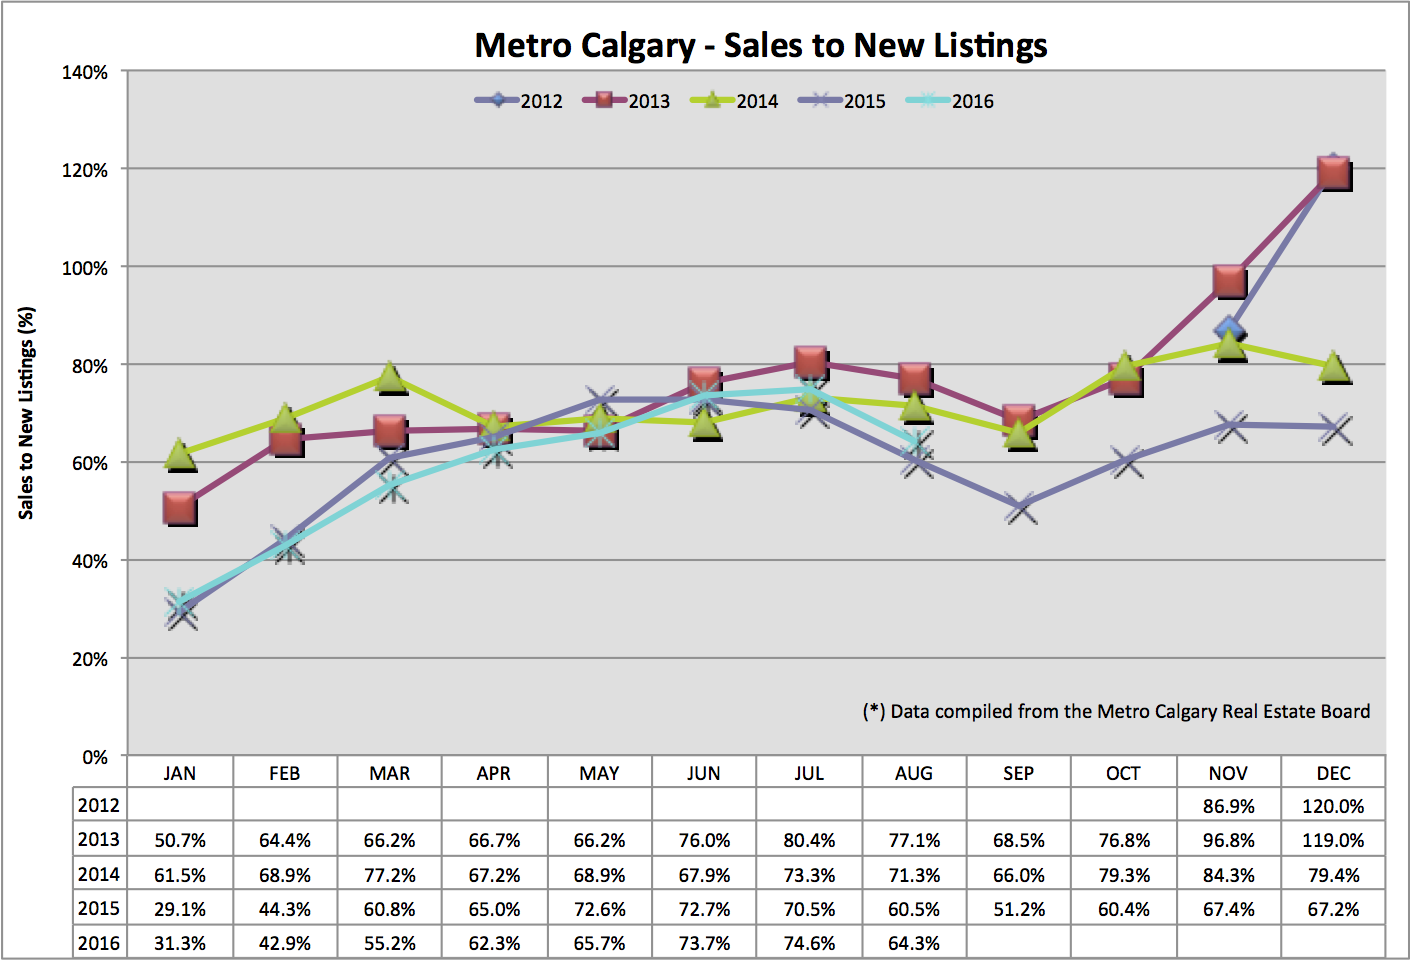
Sales To New Listings Ratio:
This ratio looks at the number of homes sold (leaving the market) versus the number of new homes entering the market (new listings). For context, a decreasing ratio (line on the graph) tells us there are more homes being added onto the market than homes being sold or leaving the market. This essentially helps anticipate future supply and therefore pricing.
Today, we are at about the same ratio as August 2015, following the entire trend line of 2015 very closely. I do not see any reason for Calgary to continuing to follow 2015’s trend line into the Fall of 2016.
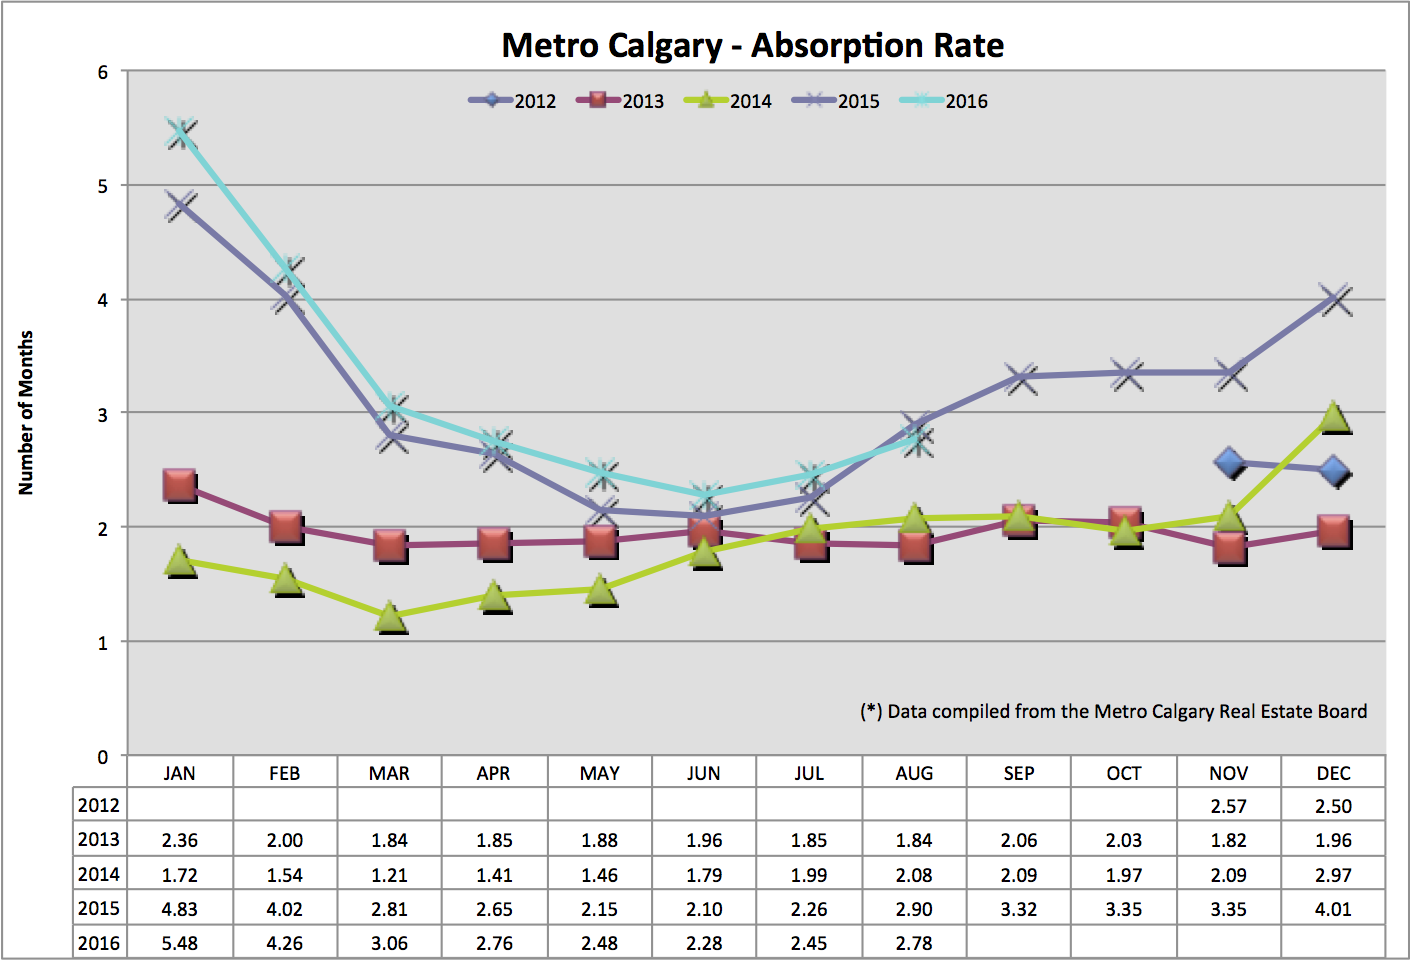
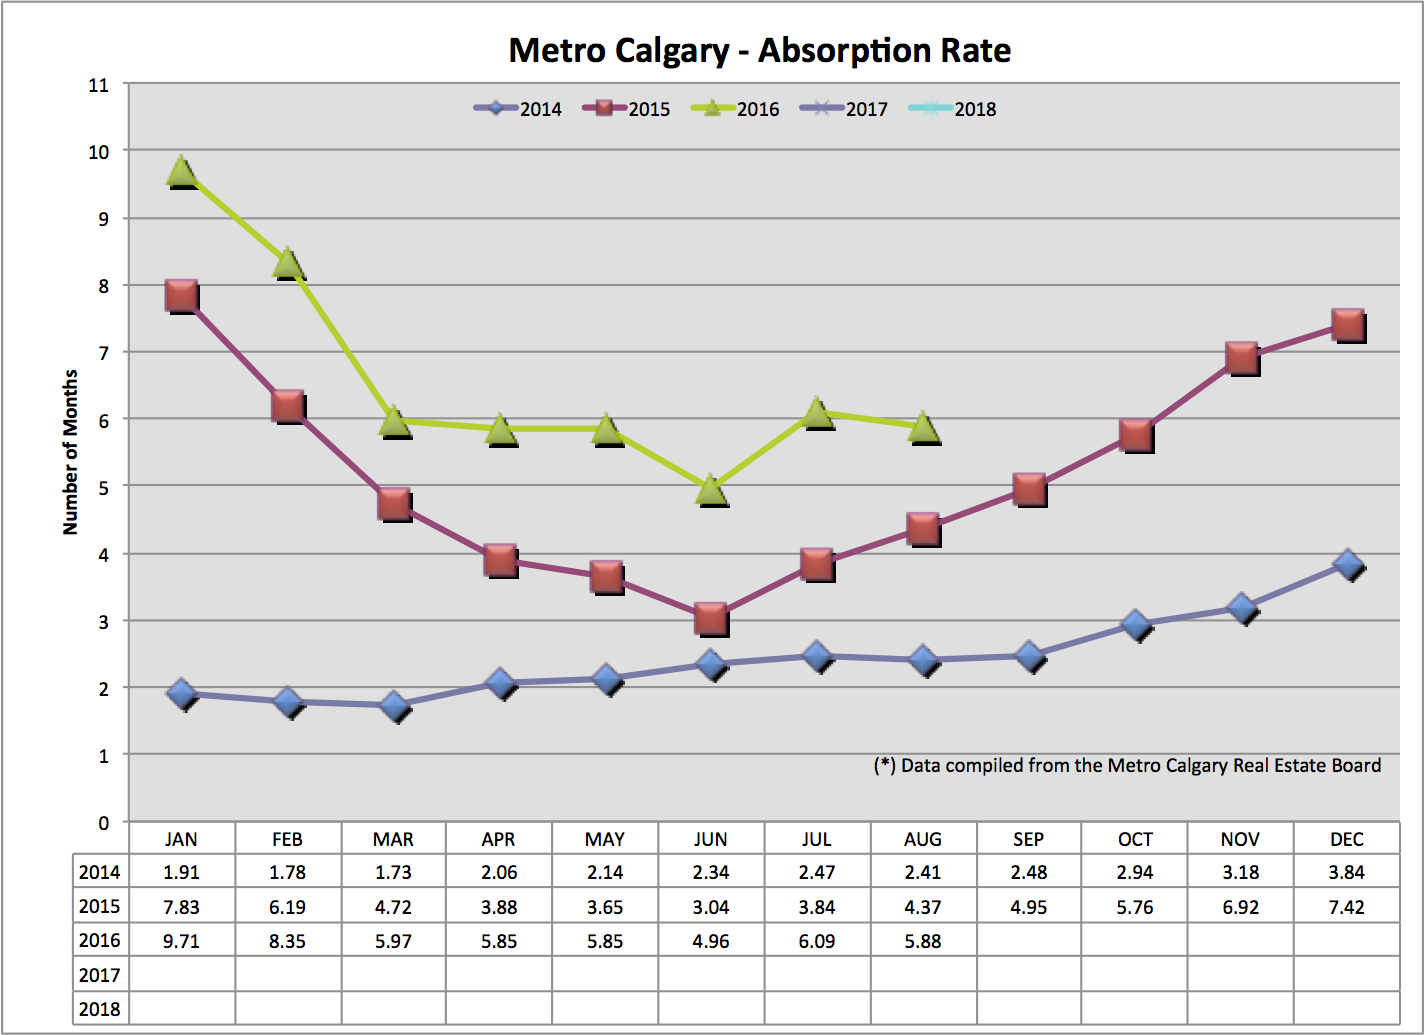
Absorption Rate:
This ratio tells us in months, how long it would take to liquidate ALL of Calgary’s Single Family Housing inventory, at the pace of sales for that current month. This helps you and I provide context around our current listing inventory and sales volume month over month and year over year. Traditionally, between 2-4 months absorption rate indicates a balanced market. A lower absorption rate is an indication of low inventory matched with high sales volume (high number of units sold). Calgary’s “hot” Real Estate market in 2014 shows the absorption rate was very low.
You and I see below 2016 is following a very close trend line to 2015. Our moth over month Absorption rate is increasing, but year over year it’s lower. Again, I see this trend continuing for the coming Fall market.
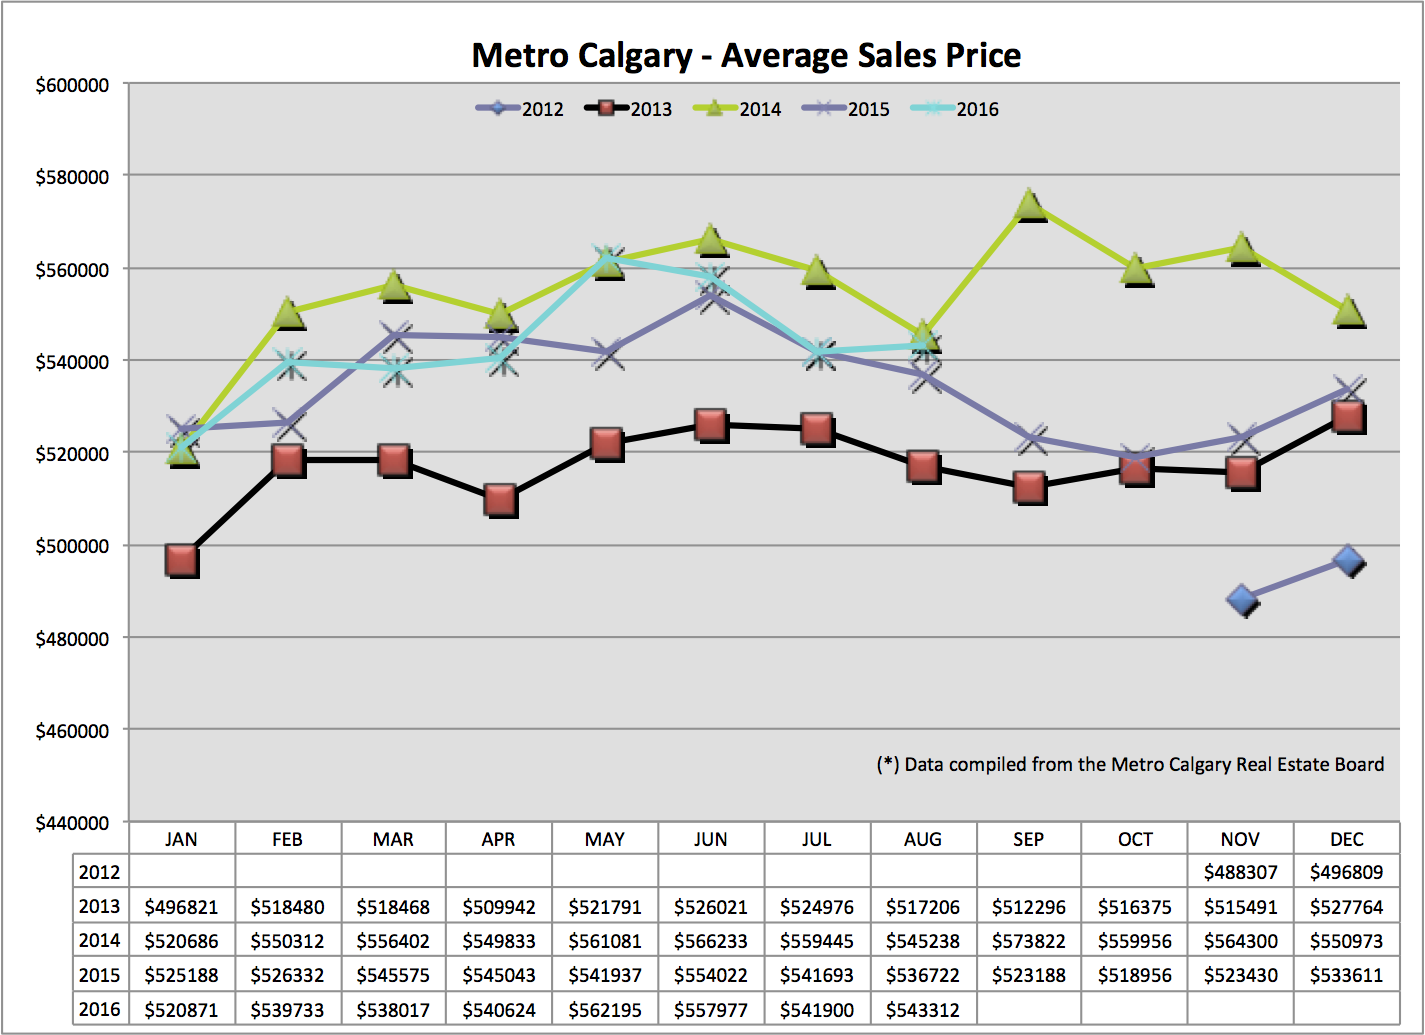
Average Price:
Looking at past Sales To New Listings & Absorption Rate data, and how that translated in to Average price movement, helps you and I look at today’s data and make reasonable predictions of what the next several months might look like, in terms of price movement. Let me know your thoughts in the comment section below.
Apartment Data For Calgary Metro:
When considering this data, like me, you might notice it more erratic. I think this is due to a smaller pool of data. Nevertheless, I think trend lines can still be established along with a general context of anticipating near term market movements.
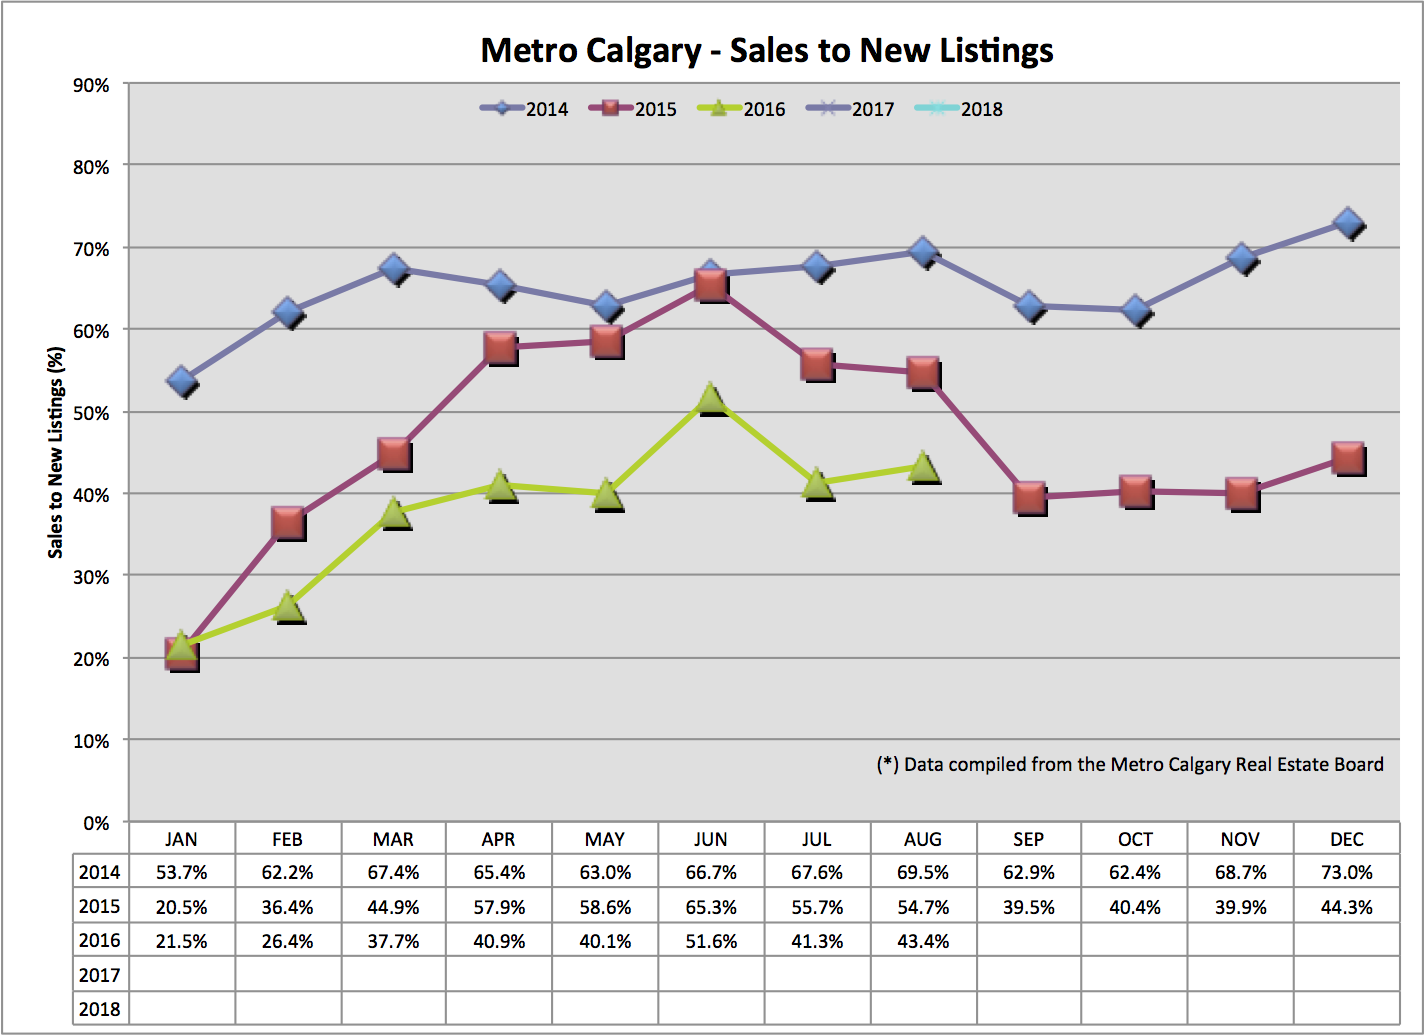
Sales To New Listings Ratio:
[See above explanation of this ratio for context]
I think the biggest note is how 2016 is following a similar trend line as 2015. I think the difference being 2016 is trending well below year over year numbers. However, the 2016 trend line is slopping upward which indicates less inventory. Perhaps the plateau we saw in this ratio, in Fall 2015, has began one month early?
Absorption Rate:
Again, a similar trend line to 2015 has been unfolding in 2016. We can see the significant difference in the absorption rate between the hot Real Estate market of 2014 compared with today. For the past two years, year over year data has been bumping higher and higher. I do not see any reason for the 2016 trend to continue following the 2015 trend. I think this equates to continued softening of apartment prices in Calgary.
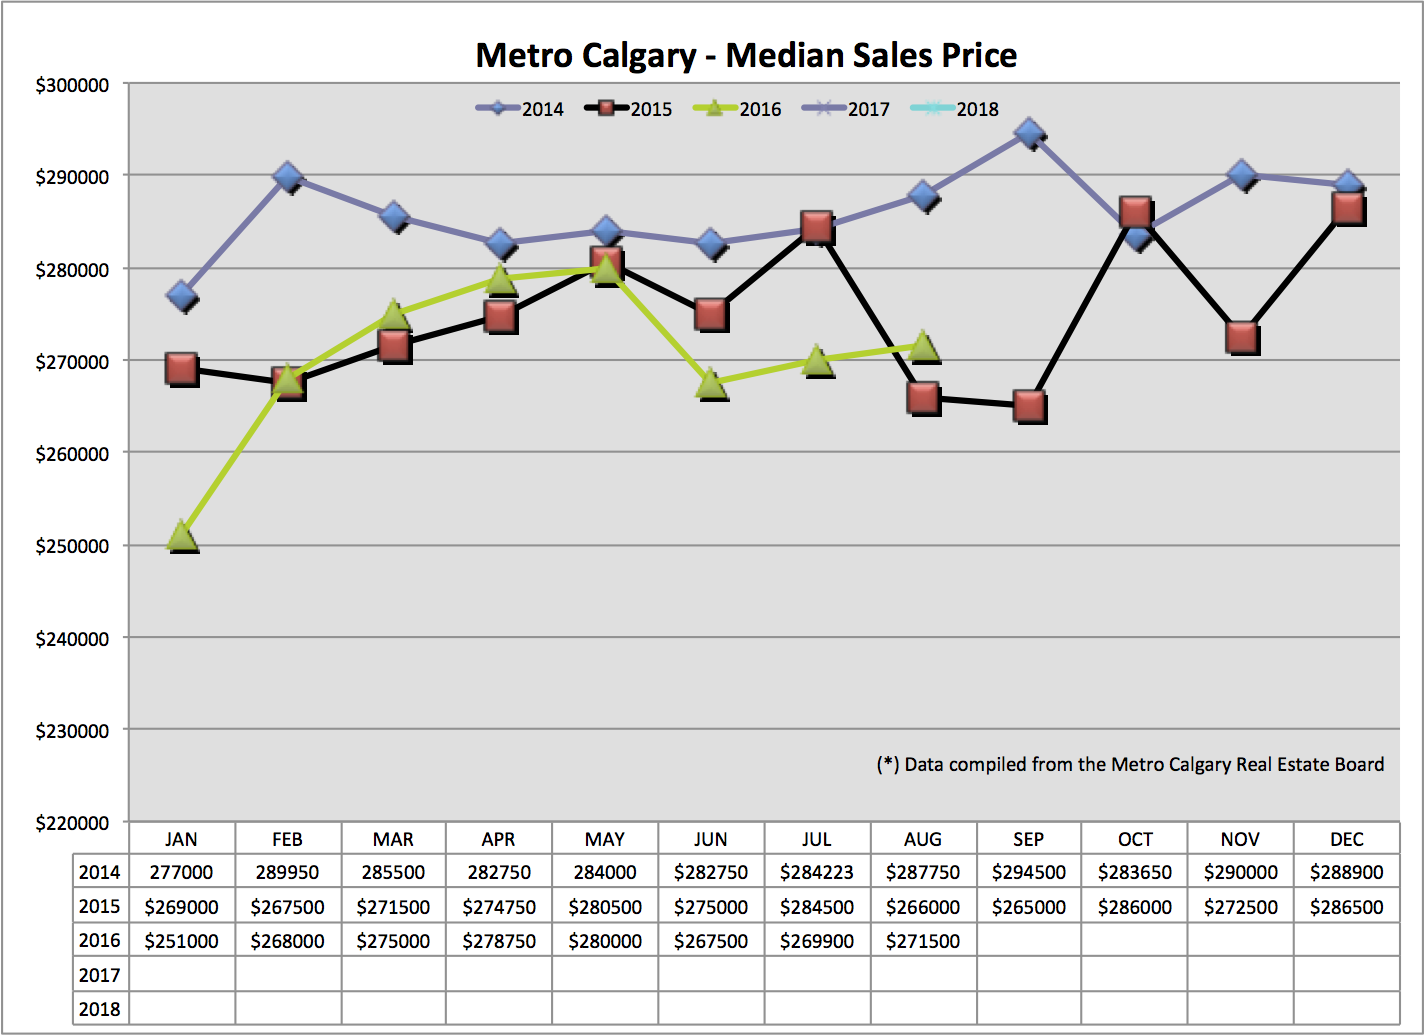
Median Price:
The erratic nature of these data points, I think, are due to a smaller pool of data. That said, I think trend lines can be established, keeping in context previous years movements relative to sales to new listings and absorption rate data.
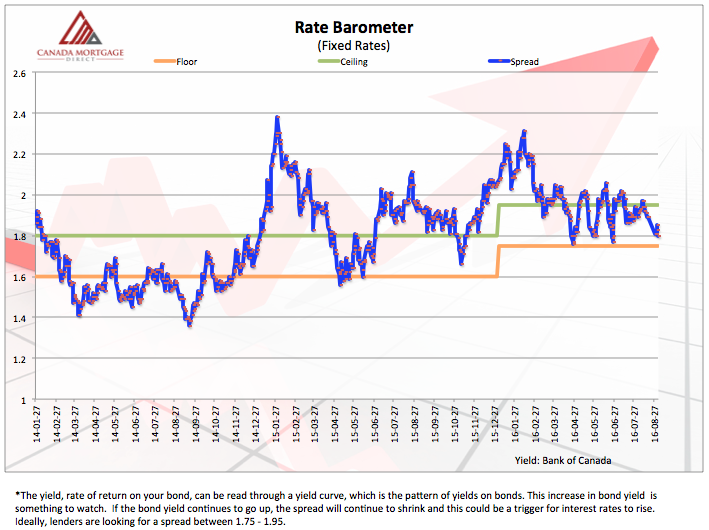
Interest Rate Barometer:
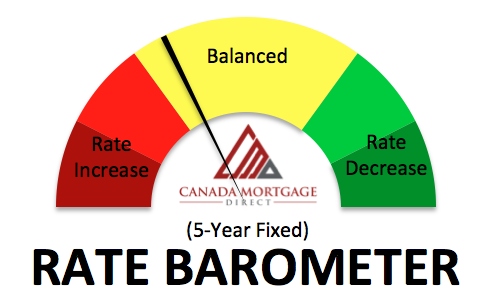
Fixed interest rates are derived from the Canadian Bond Market. Looking at the movement of Bond prices helps anticipate near term fixed interest rate movements. Below you see a graph showing the spread between Bond yields and current fixed interest rates. Below that is a second image interpreting this data into a likelihood of a near term interest rate increase.
Mortgage Shopping:
If you plan on refinancing or renewing your existing Mortgage OR obtaining a new Mortgage (1st or 2nd property) you might want to shop around in the market. I encourage you to adopt the mindset of first choosing WHO you work with, THEN choose WHAT product/term/rate etc.
I actually go out of my way to help, those who are interested in shopping around with their Banks or Mortgage Brokers, execute on their Mortgage shopping. I find this no pressure, friendly and helpful approach works will for (almost) everyone involved. I want you to feel confident in your decision to work with me, and frankly, turn away people I don’t think are a good fit to work with.
See my contact details below to connect with me.
Mortgage Sharing:
If you like this summary of Calgary Real Estate content, please let me know by clicking the like button at the top of this post. If you have any questions/comments please call/email me directly or comment below.
Thank you!
Talk soon,
Chad Moore