Each month I am bringing three housing statistics to help you ANTICIPATE where the price of Calgary Real Estate may trend.
If you are 6-12 months away from purchasing a home, I think this is valuable information for you.
Why?
Because some of The MOST asked questions are:
1. “What’s happening in the market or how is the market?”
2. “Is now a good time to buy?”
3. “Should I go fixed or variable (interest rates)?”
I also want you to feel 100% confident in your decision to purchase a home by clearly understanding where we are today, and what may happen in the market over the coming months as you begin shopping for a home.
I bring this information to you to earn your business, testimonials and referrals. If you plan on speaking with you Bank about your Mortgage pre-approval, be sure to download my “shopping around report” (free of charge).
I am REALLY surprised as some of the answers I hear the Banks give my clients when they ask these questions. You may be surprised too? Download that report here.
Calgary Statistics Market Report For June 2015
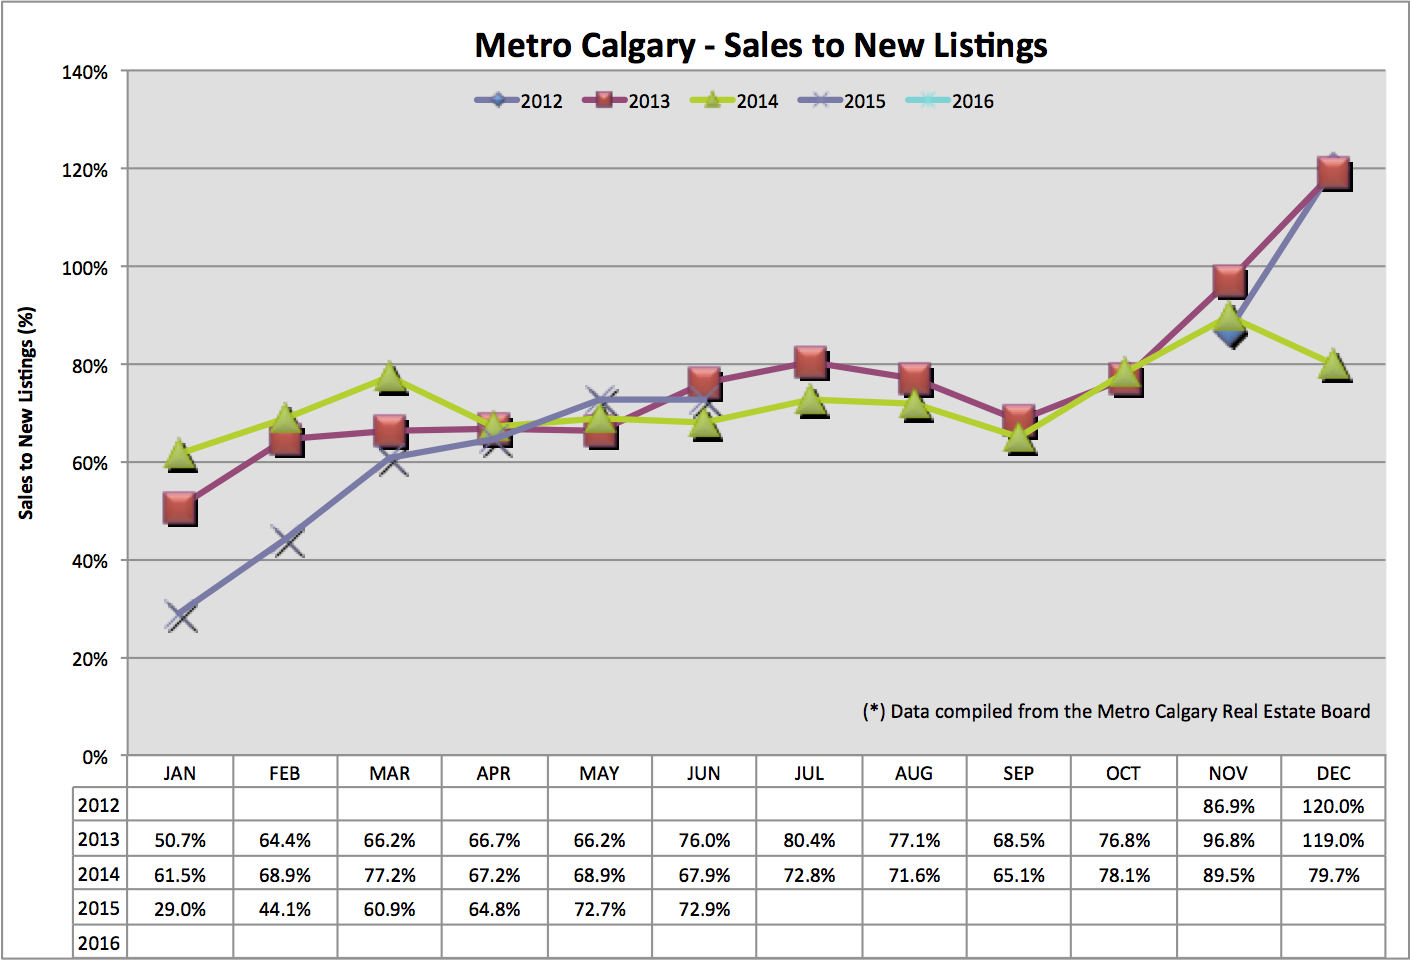
Sales To New Listings Ratio:
This ratio analyzes the amount of new listings coming onto the market relative to the amount of sales, or homes leaving the market.
A low ratio indicates there are A LOT of new listings coming online. Home prices, like everything for sale, is driven primarily by supply and demand. IF there are more and more listings being added to the market that creates downward pressure on future pricing.
Below you can see Calgary’s detached Sales to New Listings ratio sitting at a about 73% which is about the same month over month and year over year.
Housing supply is a HUGE factor in the home sales. The fact that Calgary’s market does not have a lot of inventory is helping to stabilize pricing.
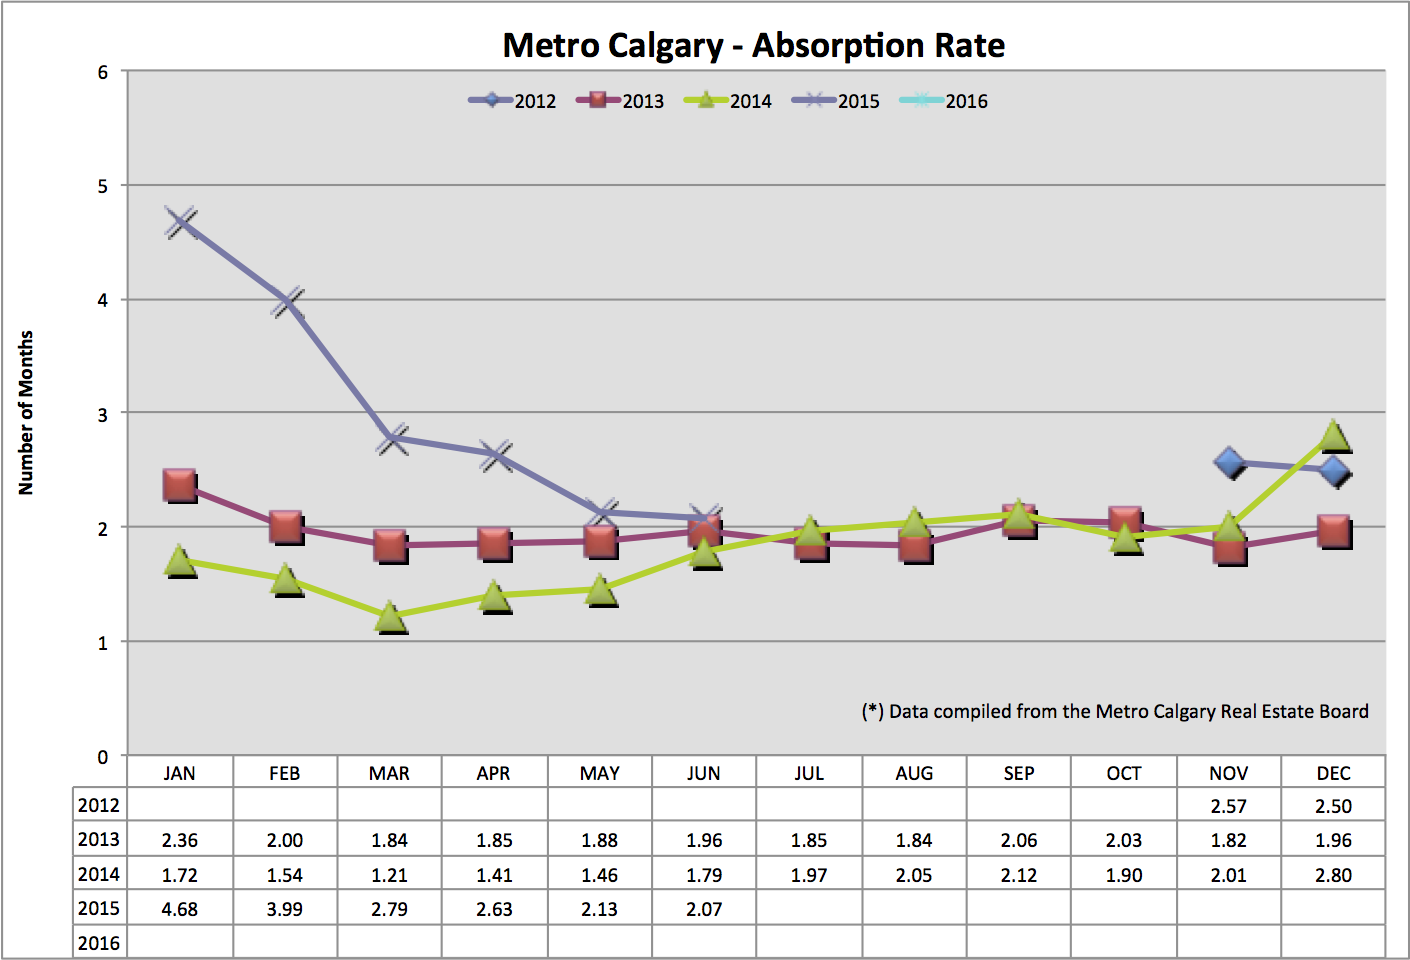
Absorption Rate:
This ratio also helps us ANTICIPATE future home prices. The absorption rate tells us in months, how long it would take to liquidate all current listing inventory at the pace of home sales for that particular month.
If listing inventory is high, with a low sales month, the absorption rate increases. If listing inventory is low, with high sales volume, the absorption is low.
We can see June 2015’s absorption rate at about 2 months which is slightly down month over month and a little higher year over year. Traditionally a “balanced market” is between 2 – 4 months.
With our Sales to New Listings Ratio and our Absorption Rate month over month AND year over year about the same as previous years, I think it is safe to predict detached Calgary home prices to match the July & August 2014 trend.
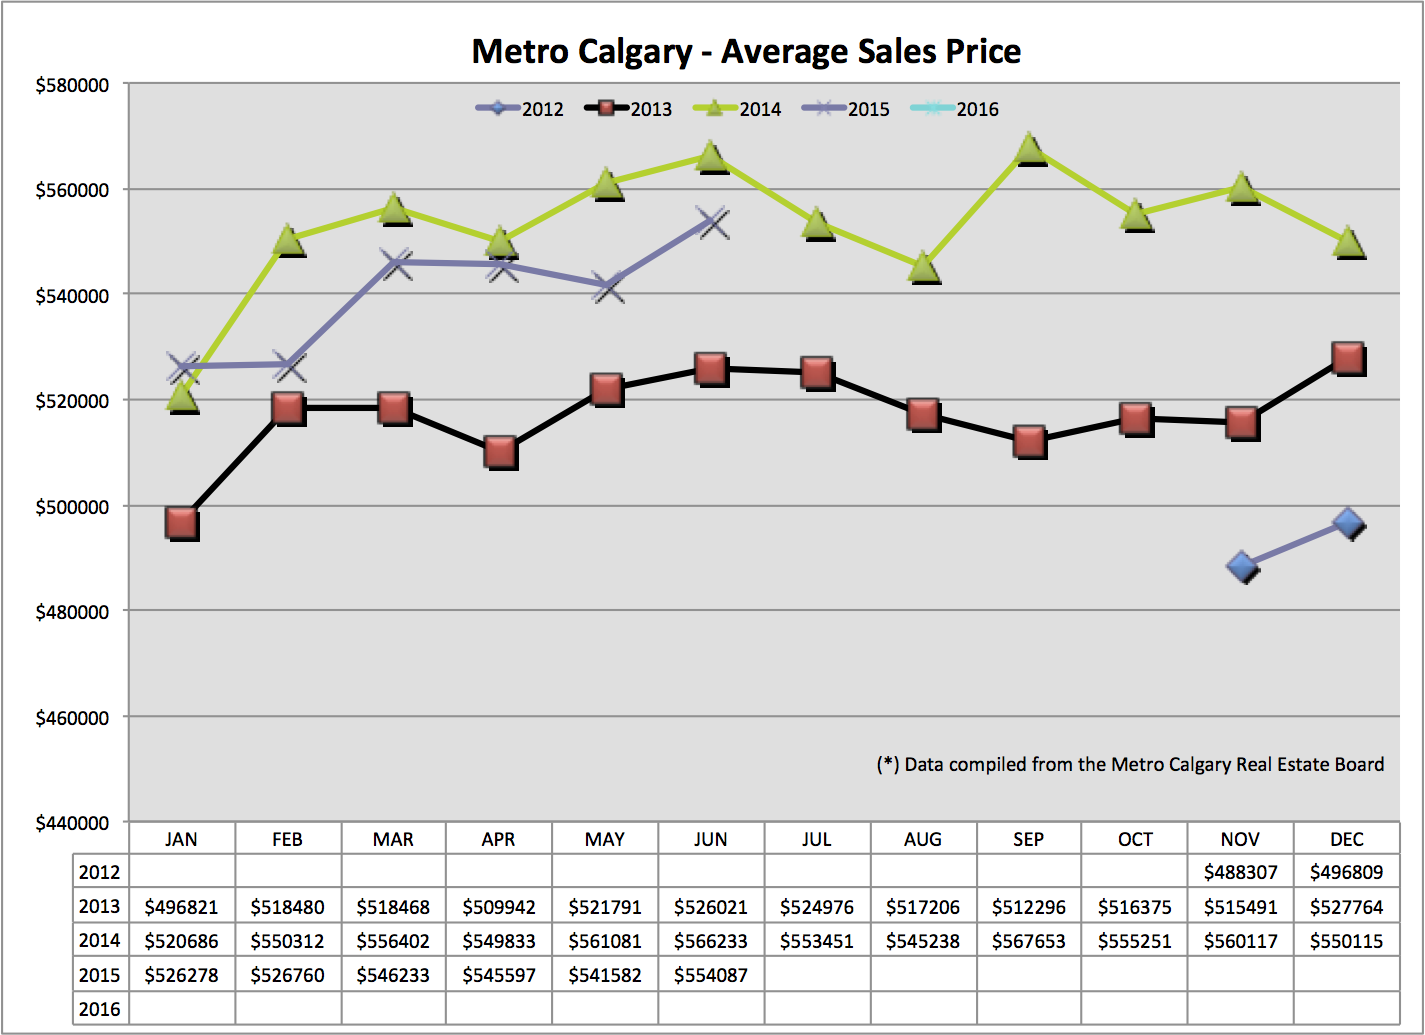
Average Sales Price:
Take the total amount of sales divided by the total home sales amount to find the average sale price. Side note: this number may fluctuate with a several large sales numbers, or lack thereof.
Month over month, the average price has increased. However, year over year our average sale price is down. Seasonally, we can see the trend of the Spring, Summer markets unfolding in 2015. I think, based on the numbers we are analyzing together here the continued Summer market will continue to trend seasonally, but lower than 2014.
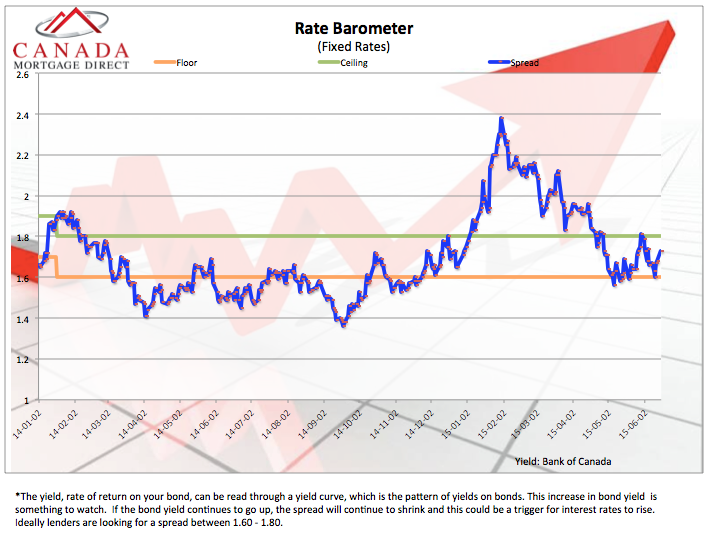
Interes Rate Barometer:
Fixed interest rates in Canada are derived from Canada’s bond market. Quite simply, Banks lend deposit money from the bond market out as Mortgage loans. Banks mark up this money to earn a profit in return for the risk of lending it. This mark up is referred to as “the spread”.
As the Banks spread shrinks or increases, determines their profitability. I think you’ll agree with me, Banks love to make money, so if their spread shrinks, eroding their profits, they react by increasing Mortgage interest rates.
The blue line you see below tracks the Banks spread. You can see the blue line is within the “comfort zone” of profitability. As the blue line shrinks closer to the lower end of the comfort zone, there is a threat of increasing interest rates.
Thank you for reading!
If you enjoy this information, please let me know by sharing it on Facebook by clicking the “Like” button at the top of this post.
Talk soon,
Chad Moore
P.S
If you’re looking at homes for sale, connect with me here. Do you think waiting until the Fall is better than purchasing this Summer?