We have a sky.
I don’t think it’s falling. That said, I remain cautiously optimistic on the future of Calgary Real Estate prices, despite what the popular opinion might be.
Below are several key data points that I look at to help anticipate near term future pricing of Calgary Real Estate. Really, what the data helps us understand are “supply side” metrics.
As you know, supply and demand effect the price of commodities, including Real Estate.
I am also aware of “demand side” metrics that are, but not limited to:
I think understanding, and anticipating supply and demand of Calgary Real Estate helps anticipate future home price movements. This matters to you IF you are thinking about entering the market (buying) or selling you home.
Okay, let’s get down to the statistics!
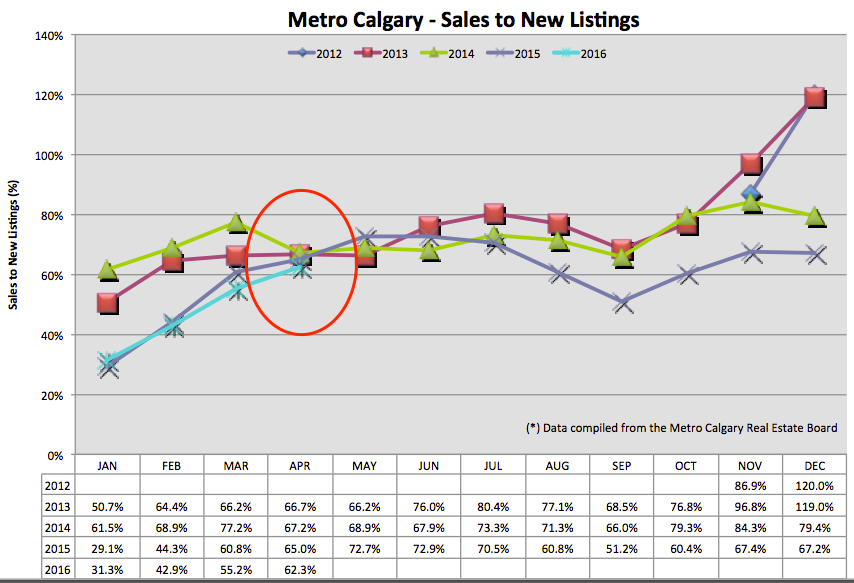
I am keenly aware of this data point. Why? Because I think it is the best indicator for anticipating future listing inventory. As you know, the more listing inventory we have, with relatively little change in demand, the more downward pressure on pricing there is.
For context, the lower sales to new listings ratio trickles down, the more and more new homes are being added to the market, net of homes leaving the market.
Our sales to new listing ratio let’s us know if we’ll have a glut of homes for sale, driving down prices.
Month over month this data point is up (less inventory) but year over year, this data point is lower (more new homes). I see this trend line to be about the same as this time in 2015. I also do not see any reason for it NOT to follow the trend line over the next couple of months.
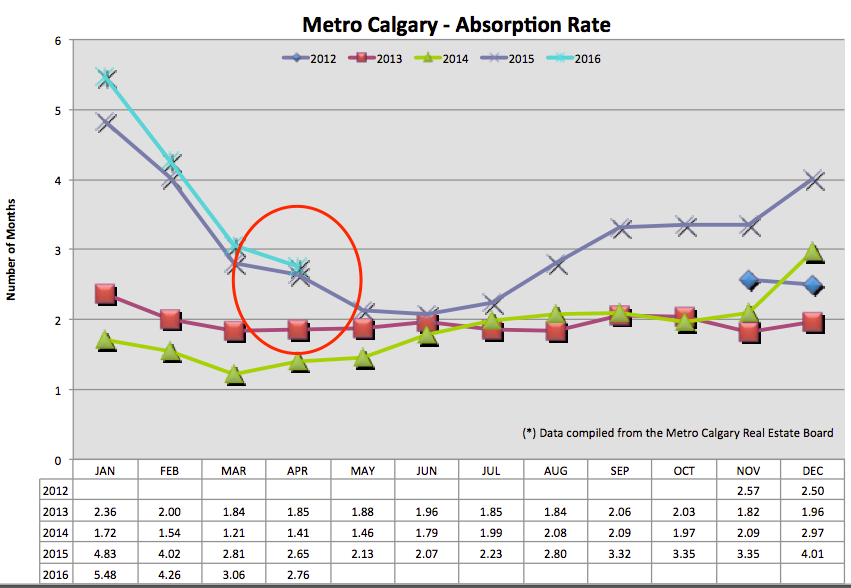
Here’s what important about this data point: It tells us in months, how long it would take to liquidate ALL of the single family home listings for sale, at the pace of the current months sales.
This gives us an idea of the sales volume, relative to the amount of listing inventory available.
For context, between 2-4 months is a balanced market. The higher the absorption rate is, the more buyers have control. Just the opposite is true with a low absorption rate; sellers have more selection of home buyers.
Again, you’ll note our absorption rate is about the same as this time last year, following the same trend line. Unless there is a drastic change, I don’t see any reason to think this metric is going to significantly change over the next several months.
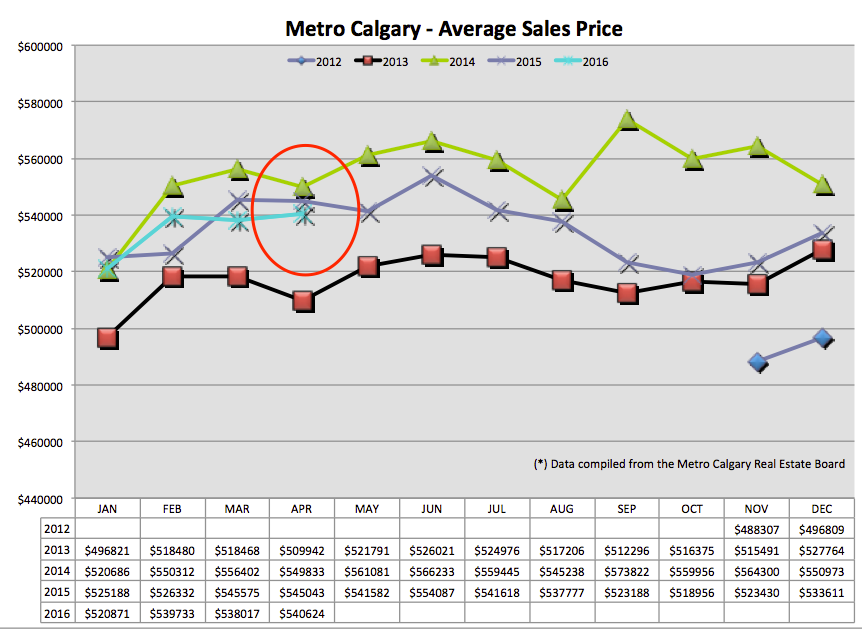
I think this number is skewed. Here’s why: There have been a number of homes for sale over the $1M mark. In fact, 22 homes sold for over $1M in the first 14 day’s of April alone. Perhaps there is great value in that price range? Perhaps sophisticated home buyers are “seeing the bottom” in that price range and deciding to purchase?
Either way, please take the average data point with a grain of salt. Each area within Calgary is going to function in its’ own microcosm, either performing better or worse than the overall market.
However, based on the sales to new listings data and absorption rate, the support of the average price is somewhat predictable.
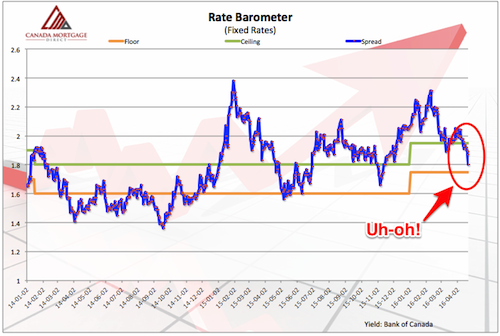
Mortgage interest rates are primarily derived from yields on the Canadian bond market.
Knowing this helps us anticipate near term interest rate increases.
The blue line from below represents the “spread” between bond yields and interest rates. As the spread decreases (blue line lower) there is a threat of interest rates to increase.
Banks love to maintain and or increase their profitability. When their margin on Mortgages decreases, they increase their interest rates to regain the same spread, maintaining profitability.
Chicken little’s of the world are still worried about Calgary Real Estate. And like I began with, I am cautiously optimistic.
One idea that is looming for me is what happens when all the severance package money runs out for people who have been laid off?
I think Calgaryian’s are resilient, innovative and hard working so I am sure more and more people are finding new sources of income. But if my income doesn’t cover the cost of my monthly bills, eventually I run out of “dry gun powder” and need to sell assets for money. And that might trickle into our housing market. Hence my keen eye on the sales to new listings ratio.
If you appreciate this content, please share it on your social media sites or email the link to people who you think would find this valuable.
Thank you,
Chad Moore
Here are some Calgary Real Estate numbers, across all property types, out of the gate for…
Hey Guys! Tariffs are here. Now what? Tiff Macklem, governor of the Bank of Canada, gave…
Hey Guys! The Bank of Canada publishes "meeting deliberation notes" relating to the discussion of raising,…
When the governor of the Bank of Canada speaks, we listen! Tiff Macklem, governor at…
Let's look back at January 2025 Calgary Real Estate Board (CREB) data to make sense…
Hey Guys! Here's an example of how the Bank of Canada is in a balance…