There are several statistics to track that help anticipate future Real Estate price movements. I think this also helps remove the “feeling” from our Real Estate market, and look at the data. Don’t get me wrong, I think Real Estate is an emotional area of my life, but making decisions based on emotion can cost me financially.
Here is the data for you to consider …
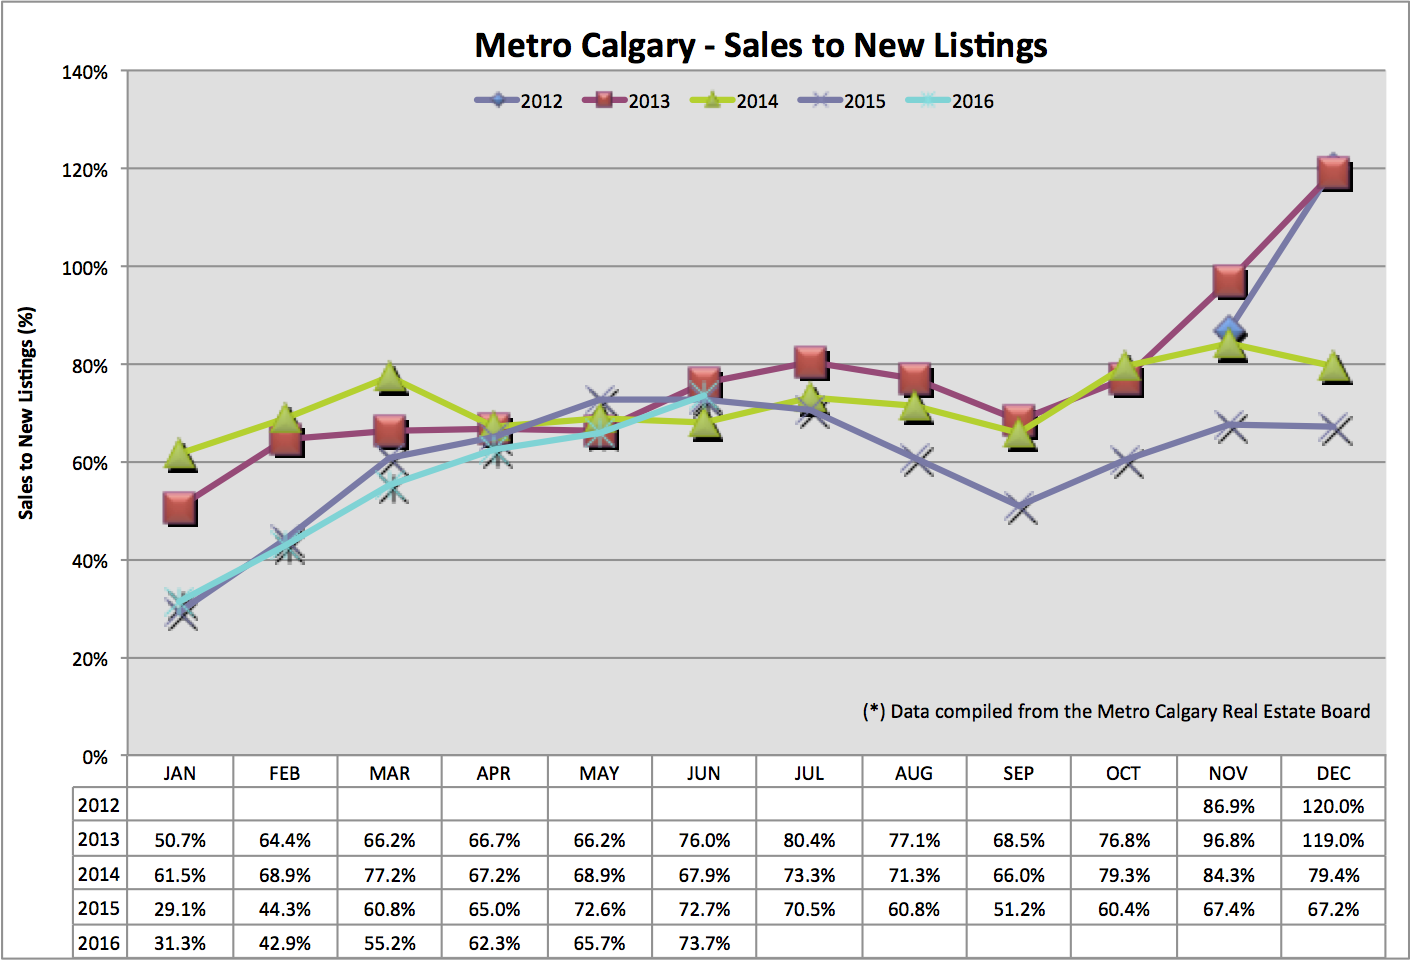
This data point helps put in context the amount of homes being sold relative tot he amount of NEW homes coming online for sale.
As you know, Real Estate is primarily driven by supply and demand. Supply of homes is a massive factor in pricing. This ratio helps us make sense of it and anticipate future price movements.
We can see the year over year ratio is seasonally the same as the previous two years. An increasing ratio indicates less new housing supply.
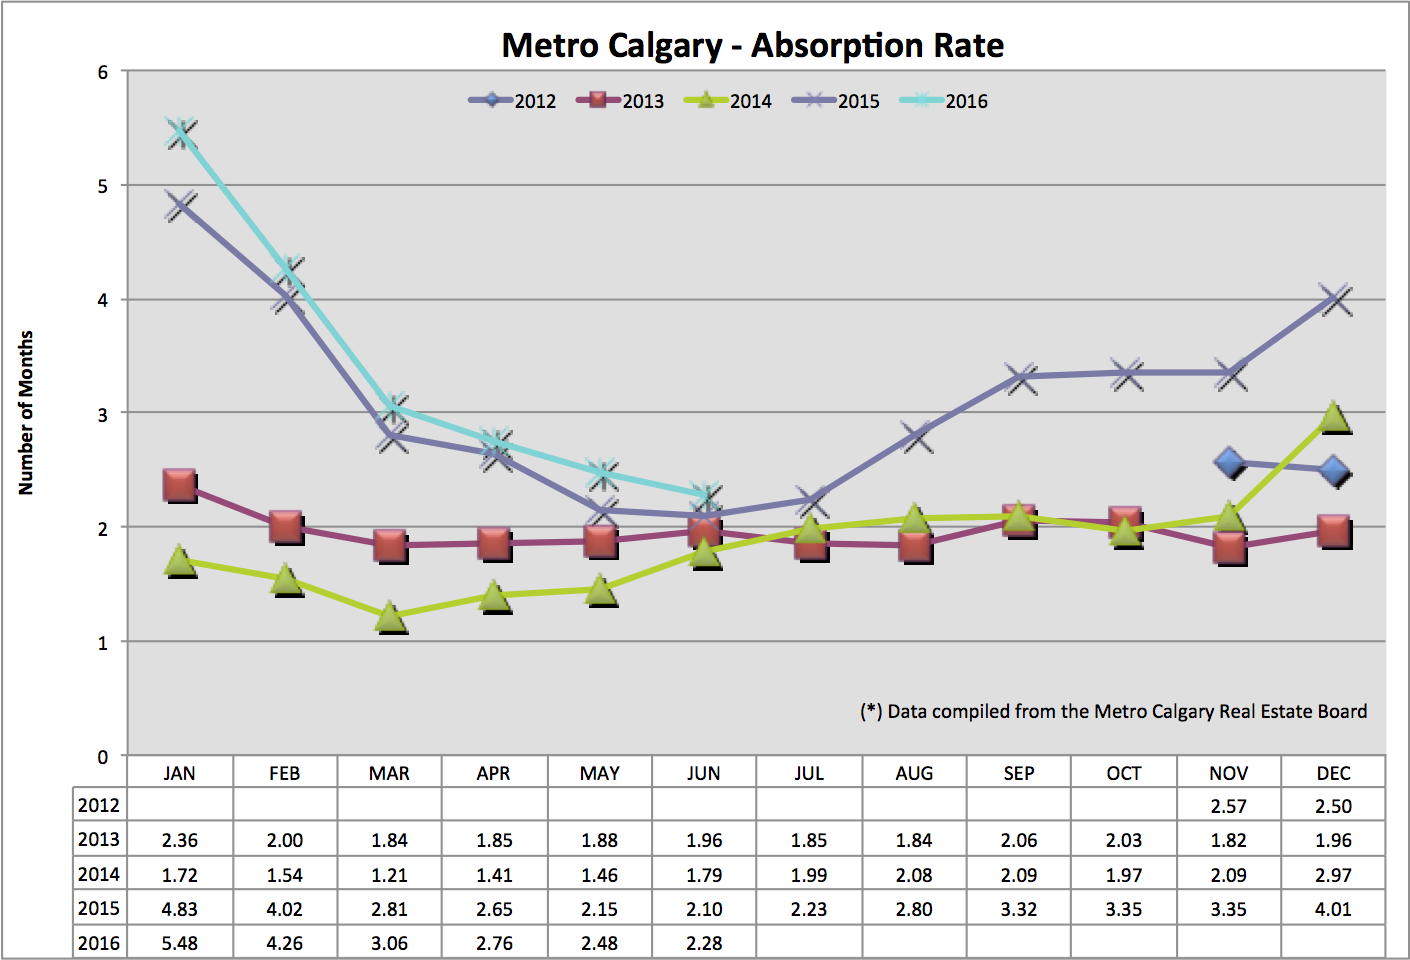
The absorption rate tells us in months, how long it would take to liquidate ALL of Calgary’s single family home inventory, at the pace of that month’s sales volume.
For context, the lower the absorption rate, the more geared towards a “sellers” market it is. A sellers market leads to lower inventory, higher sales volumes and increasing values. The opposite is true in a “buyers” market.
Calgary Single Family Homes are at just above two months absorption which is relatively low.
NOTE: If we see a decreasing sales to new listings ratio and an increasing absorption rate, look for downward pressure on prices. The 2015 data points show this relationship very clearly.
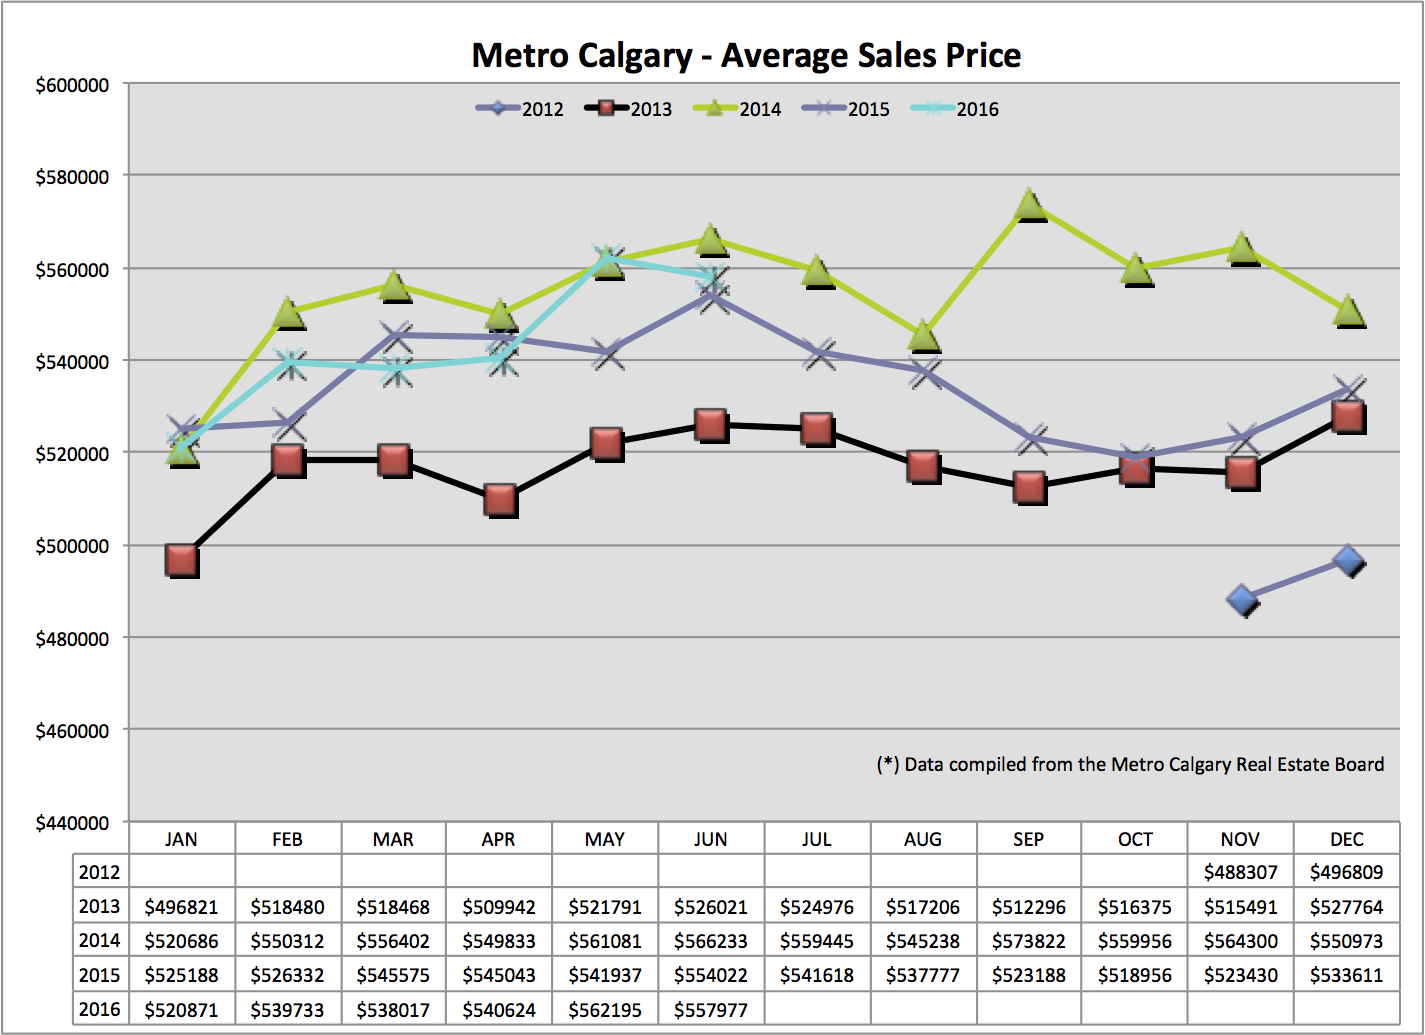
Like any average, this provides a general context and trend line to help us understand month over month and year over year differences. Beware, the average price can be skewed up or down by the addition or lack of large ticket home in Calgary.
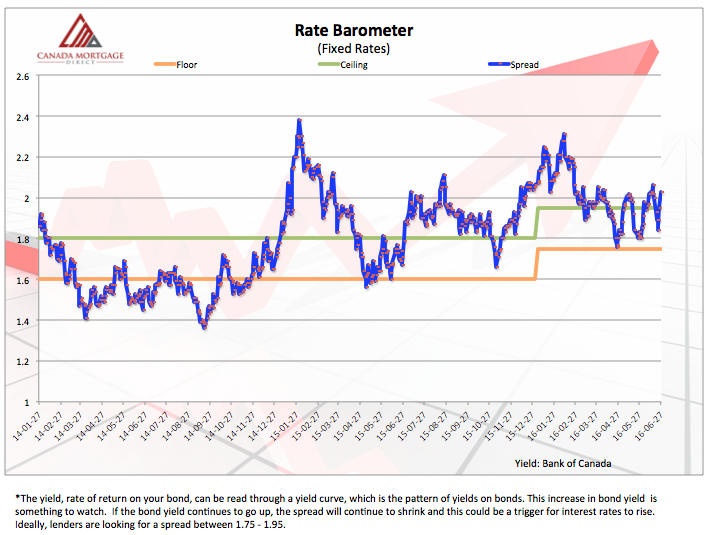
Fixed interest rates are primarily derived from the Canadian Bond market. And as such, we can anticipate near term fixed interest rate movements. The blue line in this graph is the spread between the bond market and interest rates. As the blue line (spread) lowers, that means the Banks are making less and less money. And the Banks don’t like that!
So to regain their margin, increasing their profits again, they might increase their interest rates. As you can see, the blue line is healthily rising so the threat of increasing interest rates is low.
I don’t see any reason for the current trend line of 2016, that is closely following the trend line of 2015, to discontinue.
If this is true, we could see downward pressure on pricing over the Summer and into Fall.
Of course, keep a close eye on the Sales To New Listing ratio which turned into a very good indicator of 2015 downward price pressure.
If you have any Real Estate or Mortgage questions, please connect with me (info in my email signature).
Talk soon,
Chad Moore
Here are some Calgary Real Estate numbers, across all property types, out of the gate for…
Hey Guys! Tariffs are here. Now what? Tiff Macklem, governor of the Bank of Canada, gave…
Hey Guys! The Bank of Canada publishes "meeting deliberation notes" relating to the discussion of raising,…
When the governor of the Bank of Canada speaks, we listen! Tiff Macklem, governor at…
Let's look back at January 2025 Calgary Real Estate Board (CREB) data to make sense…
Hey Guys! Here's an example of how the Bank of Canada is in a balance…