Hey Guys!
The data below is from the Calgary Real Estate Board (CREB). Let’s look at a couple key data points so we can get a handle of what’s been happening in the Real Estate market.
This data is also helpful to predict near term trends. This will be helpful if you’re planning a sale/purchase/refinance/renewal in the future.
Let me know if you have any questions by replying to this email!
Detached Homes:
Sales To New Listings Ratio:
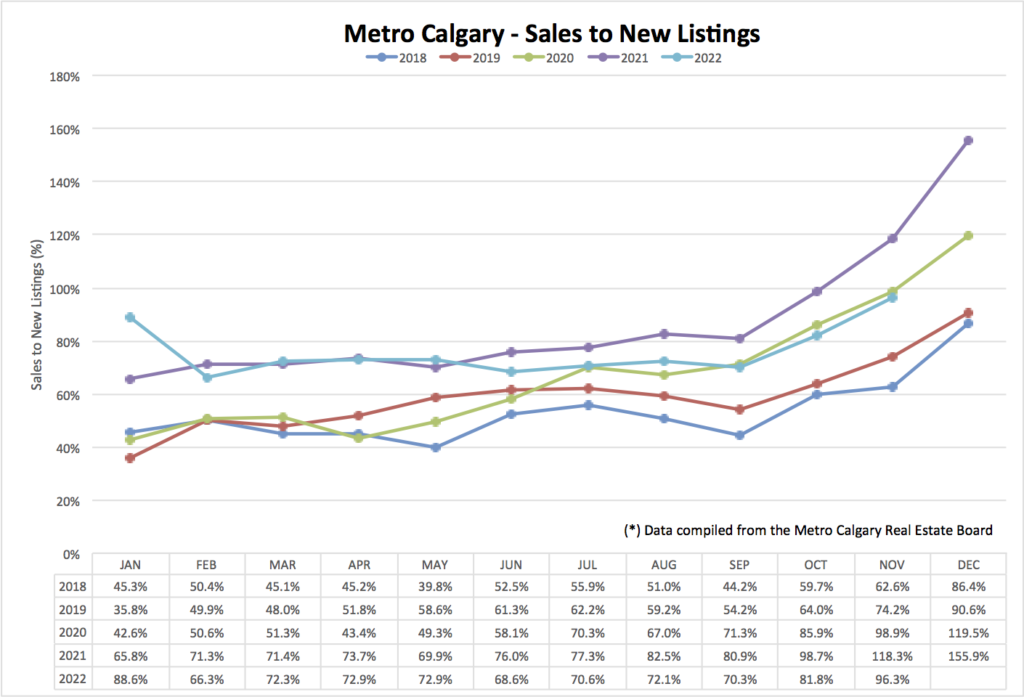
The sales to new listings ratio combines homes entering the market (new listings), with homes exiting the market (sold/expired listings).
Remember, housing price direction is governed by the laws of supply and demand. The sales to new listing ratio anticipates changes in near term supply levels.
With a sales to new listing ratio of 96% that means nearly every new home entering the market, equals one home exiting the market. This is a very tight market!
What’s difference from this time last year?
November 2021:
- New listings: 1,052
- Total inventory: 1,526
- Sales: 1,246
- Insured Mortgage rate 2.69%
November 2022:
- New listings: 849
- Total inventory: 1,568
- Sales: 818
- Insured Mortgage rate 5.19%
Sales and new inventory are both down by a similar percentage year over year.
Demand. I can think of a couple factors are contributing to lower detached housing demand being a) we pulled forward Calgary home buyer demand, b) borrowing costs are 92% higher than last year, c) the fear of missing out (I.E., parabolic equity appreciation) has subsided and, d) housing arbitrage is slowing.
Supply. Lower housing supply could be for any number of reasons, a) home owners holding out for better prices, b) investors not listing rental properties, c) sellers not seeing inventory they would like to purchase. It’s all interconnected.
That all said, as supply is on par with demand, that is fundamentally supportive of pricing. See average price detail below.
Absorption Rate:
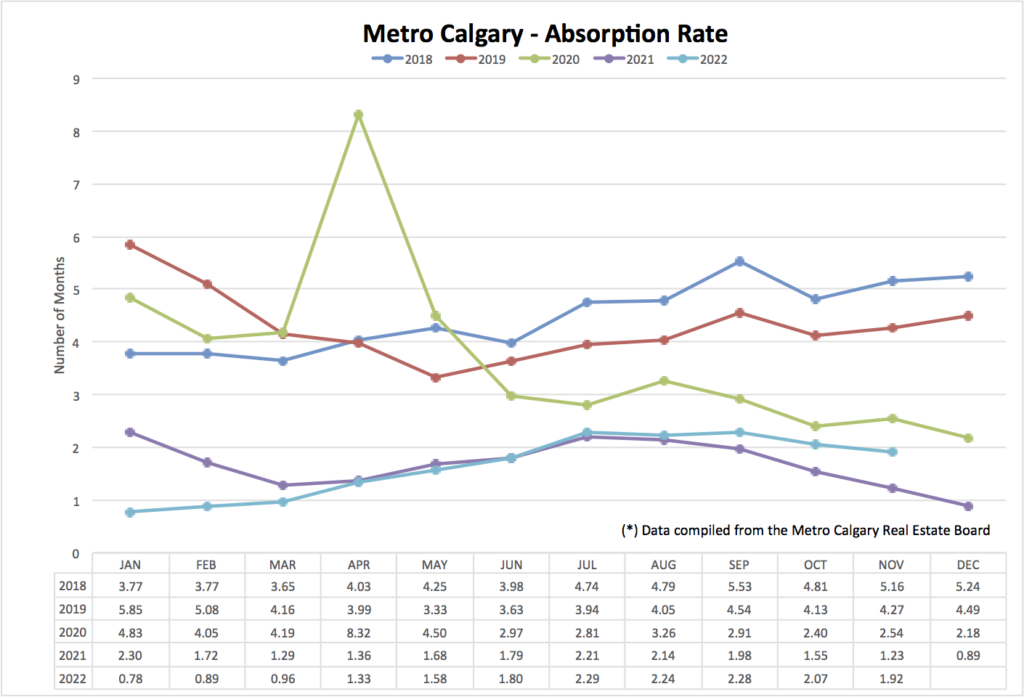
Absorption rate tells us in months, how long it would take to liquidate ALL of Calgary’s detached listing inventory based on the current months sales volume.
An absorption rate of 1.92 months is extremely low! For those buyers and sellers in this current market, in general, negotiations are in favor of the seller.
I’m still seeing multiple offers on homes for sale, and some selling over list price. I’m also seeing purchases come below list price.
Similar to pre-pandemic markets, the demand for detached homes less than $700K is more than more prices above this threshold.
Again, drivers of this are incomes required to support higher Mortgage amounts and elevated borrowing costs.
Average Price:
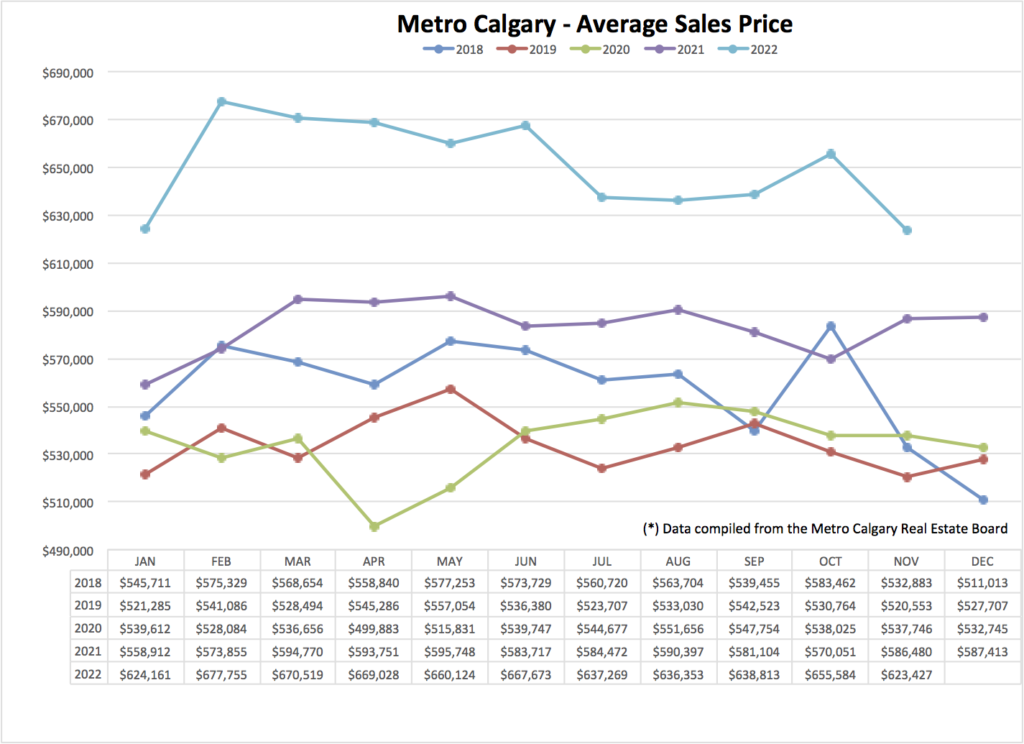
Not surprisingly, average prices are off the seven year peak, but still significantly higher year over year.
Average data does not speak to specific price points, areas or types of homes. I do find value is aggregate data as a trend.
Apartment Housing Data:
Sales To New Listings Ratio:
Here we go! Wow …
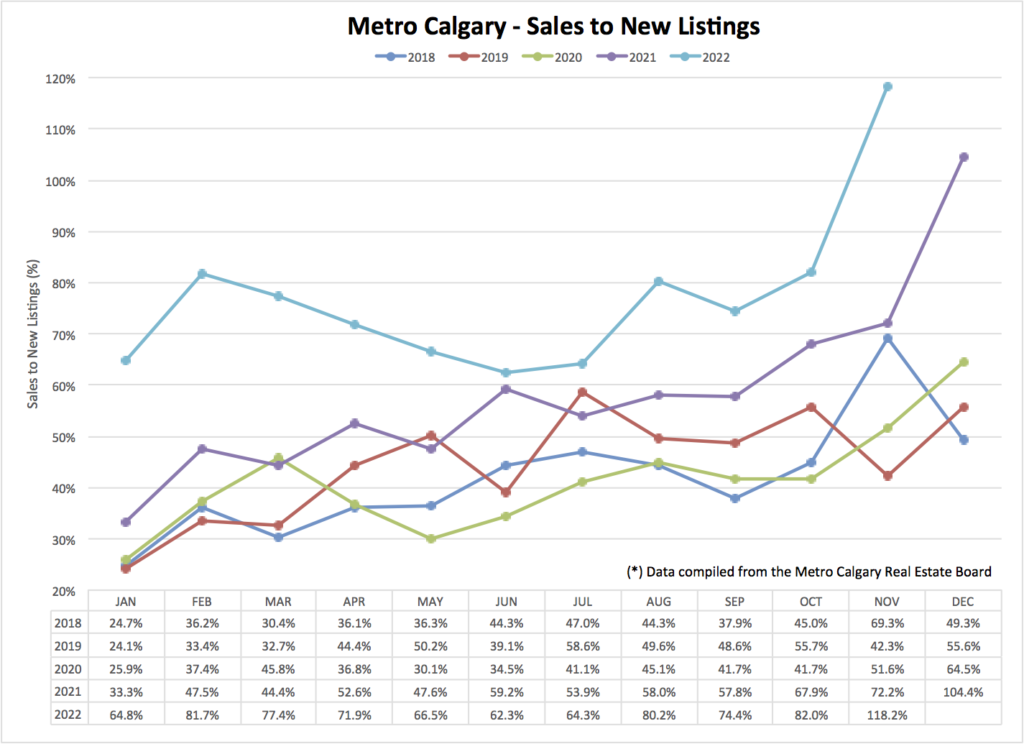
Sales to new listings data for apartment housing is through-the-roof. Here’s the data so you can see what’s happening:
New listings: 379
Total inventory: 887
Sales: 448
Guys, the stage is set for apartment prices to explode. But will they? The truth is I do not know.
Here are my thoughts that might propel price appreciation, or stifle it …
- The price point of apartments is appealing to new buyers—especially with higher borrowing costs.
- Downtown Calgary is becoming more accessible to local amenities for owners to enjoy living downtown (I.E., grocery stores, hardware stores etc). I think people in other Canadian cities might be more use to the idea of raising children in apartment condos? I think the narrative might be changing in Calgary?
- Downtown apartment prices in Calgary are significantly lower than other major City centre’s in Canada. Out of town interest might be appealing.
To be clear, the above is a lot of my anecdotal thinking, not data driven.
Absorption Rate:
Calgary’s apartment absorption rate is sinking to 7+ year lows! It would take about 2 months to sell off all apartment inventory in Calgary.

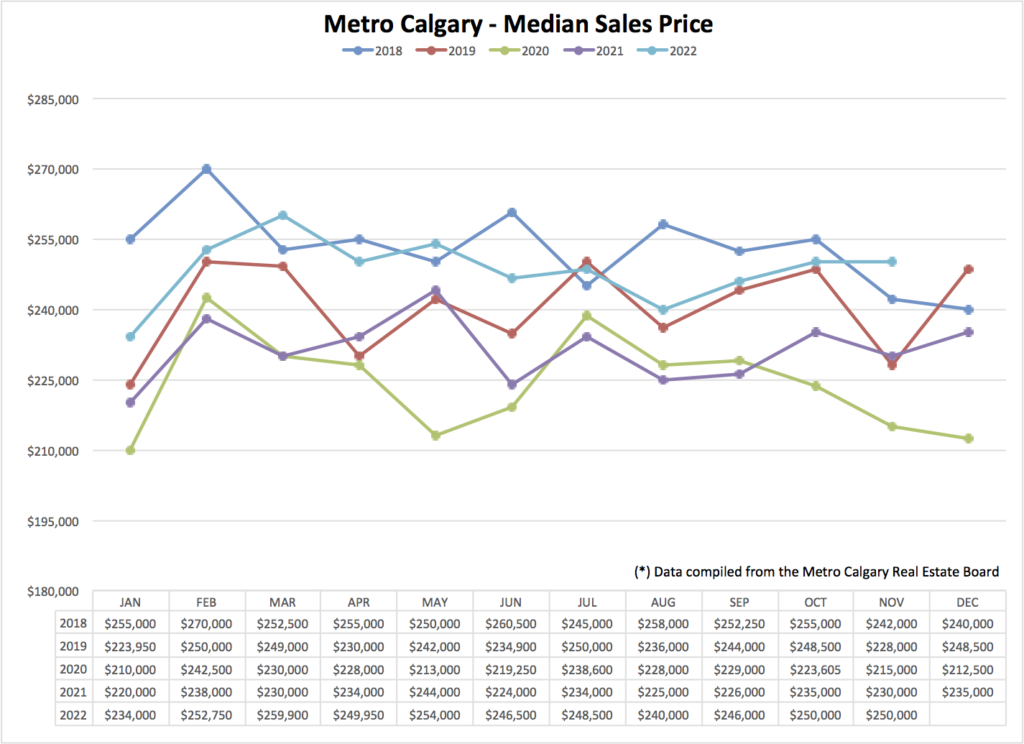
Median Price:
Median price is about flat for the 11 months of 2022. Ingredients are in place for price appreciation to happen …or are enough to give buyers confidence in current price support.
Conclusion:
Despite fundamental Real Estate headwinds from higher borrowing costs, there are supportive factors of detached housing and apartment prices.
Detached housing is supported by low inventory, and apartments are seeing higher buyer demand.
Another factor to price flooring is rental alternatives …
A quick look on www.rentfaster.ca reveals rents for an average 1 bedroom basement suite are in the $900-$1,100/mo range. The main floor of a 2 bedroom rental home is in the $1,500 – $1,900/mo range. A whole detached home is renting in the $1,900 – $2,500/mo range.
(*please note this is a very brief search with rentals available above and below my general range)
In general, the rental market offers potential sellers an alternative to selling which helps establish a sale price floor. To the extent a seller can cover the cost of their unit/building etc, the longer they can wait to sell in a future market that might be more favorable.
I hope the above is helpful! Reply to this email if you have any Real Estate related plans on your horizon.
Talk soon,
Chad Moore
P.S.
Christmas tress. They’re expensive …unless you have a permit from the AB government to cut down one of your own!
I’ve been doing this since 2013. Permits are $0 (use to be $5). Please follow the instructions and ensure you’re in an eligible area to cut your tree! Google it.

