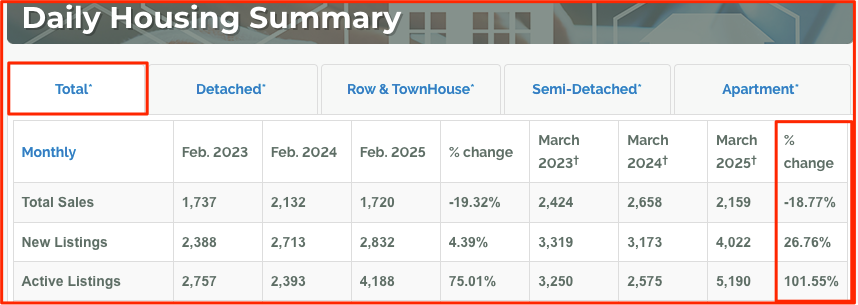
Here are some Calgary Real Estate numbers, across all property types, out of the gate for you:
Total sales: -18.77%
Total new listings: +26.76
Total active listings: +101.55% (double)
What does this mean?
The most recent year we are comparing to was the tail end of the Covid Real Estate boom.
The main drivers of that boom were 1) ultra low interest rates, 2) increased importance of home space (lock downs, work from home), 3) extraordinary population growth (people coming with money), 4) low prices in and of themselves, 5) undersupply of homes, 6) market belief prices would rise.
Some of the ingredients of the Real Estate boom are less significant now, 1) AB population not growing as much, 2) return to work initiatives, 3) prices are at peak levels, 4) builders have responded with inventory, 5) buyers/investors belief in short term price gains are less convicted.
We don’t often see this data point nose dive in the Spring market.
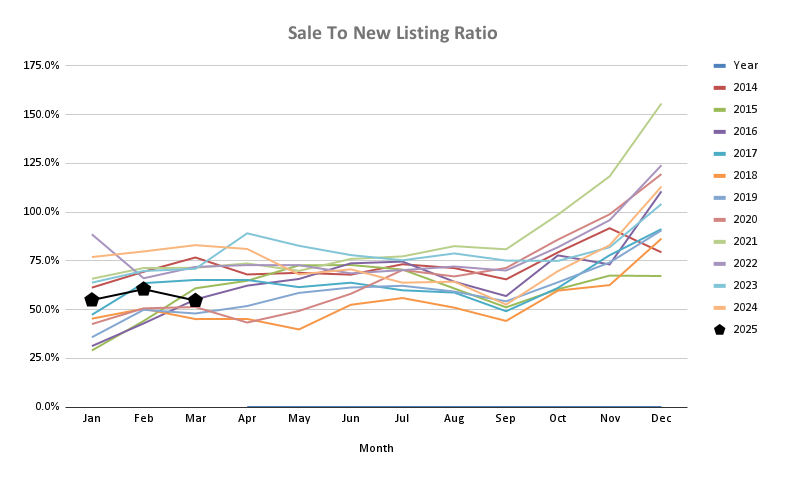
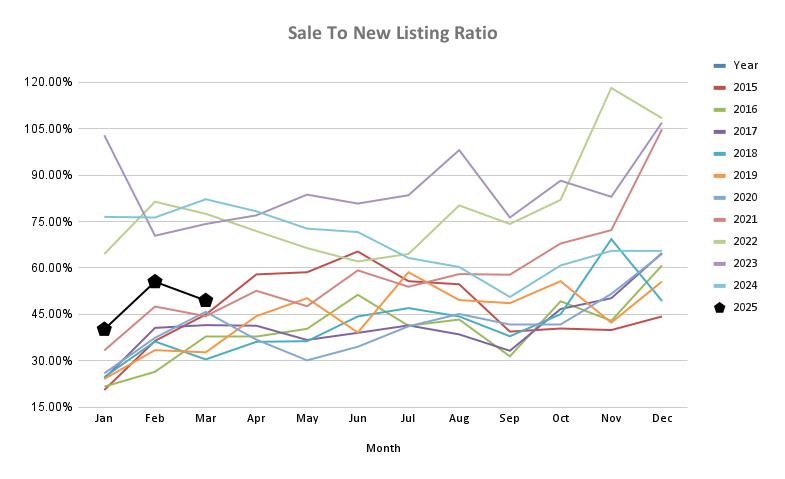
The sales to new listings ratio combines sales and new listings to help us gauge near term supply changes. Lower sales to new listing ratios indicate more near term supply.
Sales to new listings ratio data is down from 82% to 54%. What does this mean? Remember, the lower this data point is from the 100% line, the more near term listing inventory is accumulating. Said another way, there are some months with the sales to new listings ratio data is over the 100% line. This shows a reduction of near term listing supply.
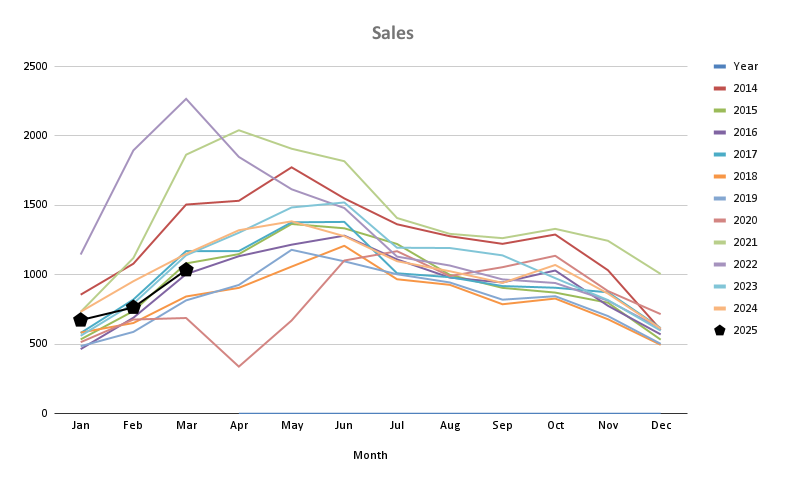
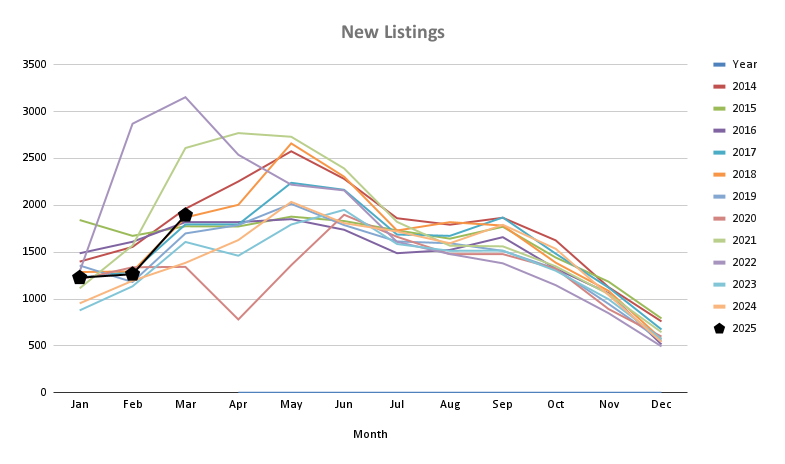
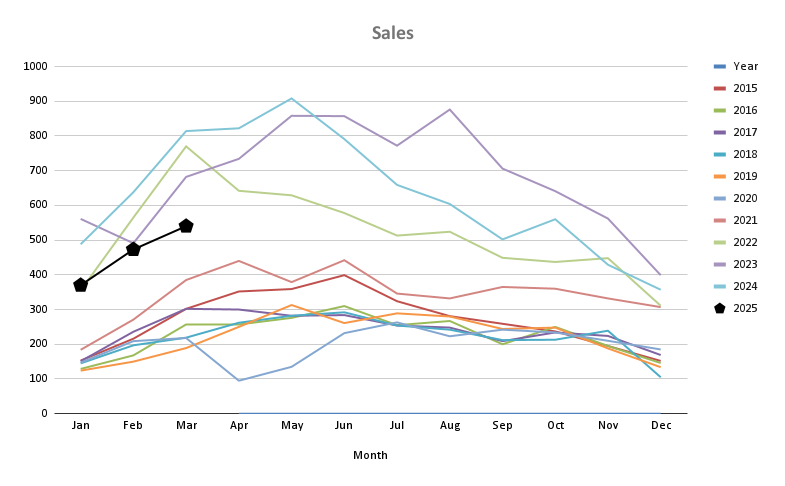
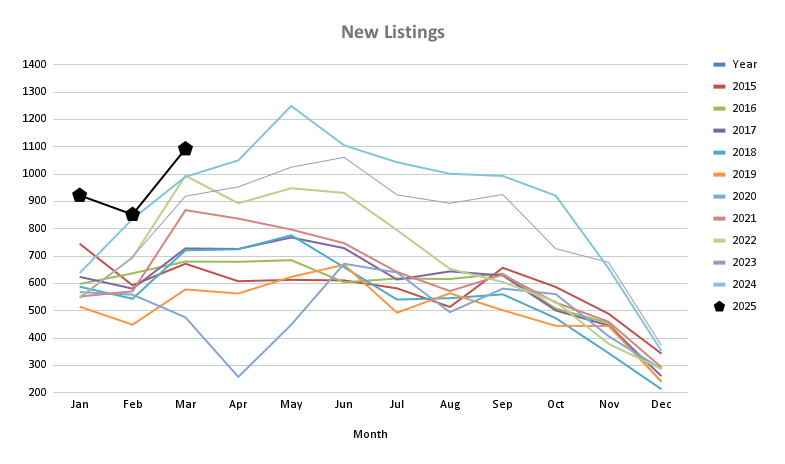
The bottom line is this, there was a lot more new listings than there were sales. I’ve added a graph showing detached sales, and detached new listings below.
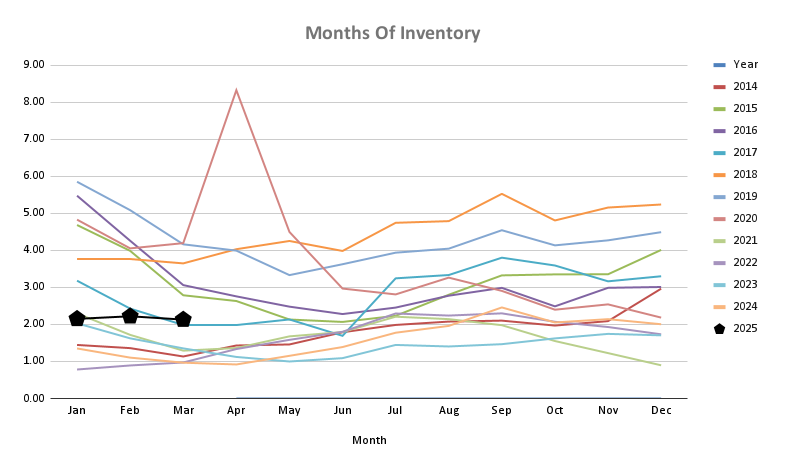
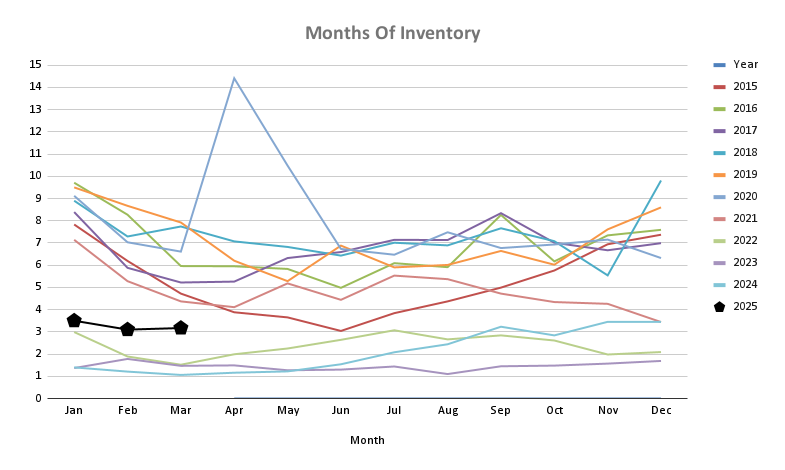
Months of inventory (aka absorption rate) tells us in months, how long it would take to sell all detached inventory, at the pace of the current month’s sales volume.
A “balanced” market is known to have an absorption rate between 2-4 months.
Technically, Calgary’s detached absorption rate is still low, at just over 2 months of inventory.
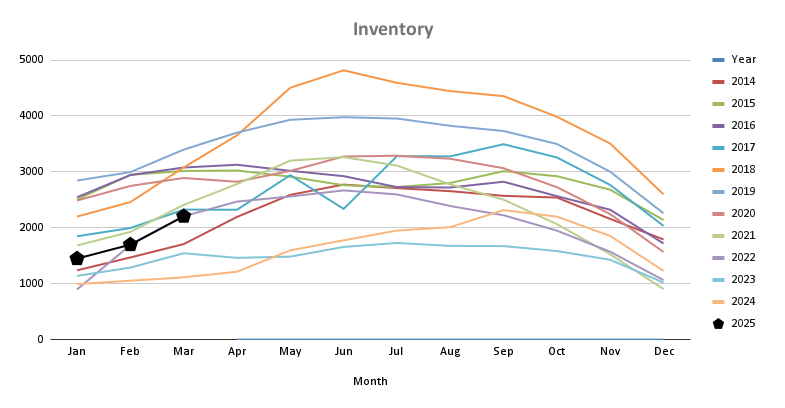
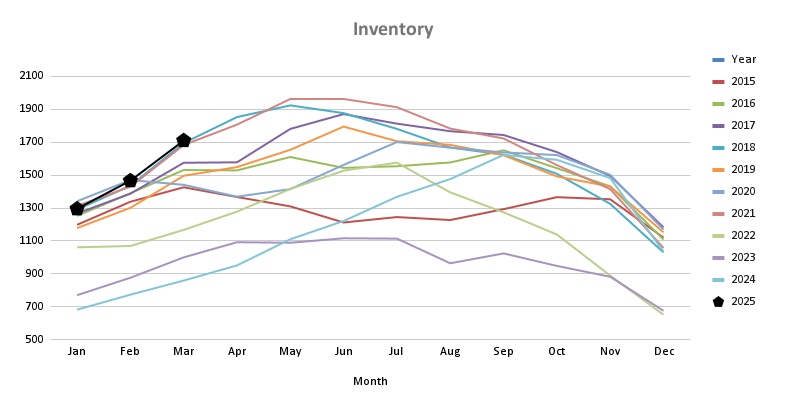
In the second chart below we can see inventory seasonally rising, but not at an alarming rate.
Just above, you can view the sales chart to see that sales are also seasonally rising.
It seems like the wild card here is new listings. If new listings continue to flood the market, highlighted by the spike of listings in March, that will drive absorption rate higher. Calgary detached sales seem to be strong, and continue rising seasonally.
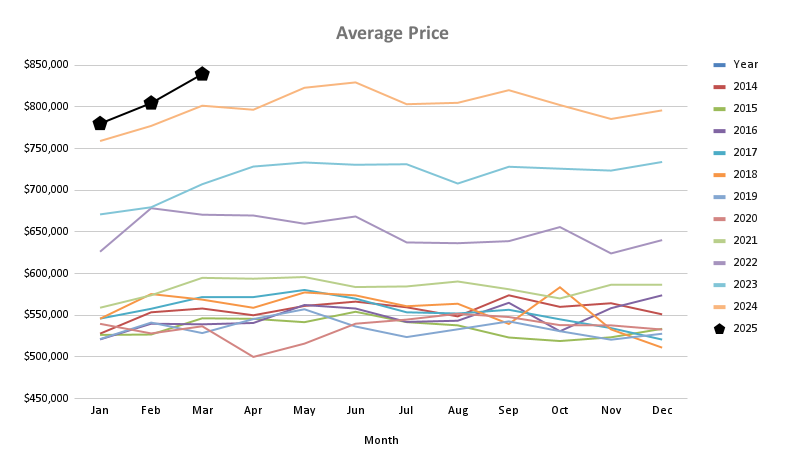
Remember, average price is average. Each price point, property type, and certainly location will change how price evolves. For all of Calgary detached listings, average price is up month over month, and year over year. I think this is a good trend to watch.
For a lot of apartment history, there is a very distinct separation between pre and covid era data. As we move through 2025 we are witnessing how the market adjusts—and it seems like we’re falling in the middle.
The sales to new listings ratio is way down year over year, but still higher to pre-covid era (silver lining).
Calgary apartment sales are strong, relative to pre-covid era but well off the covid boom peak.
What is worthy to watch is the amount of new inventory coming up for sale. In the third chart below, we can see an interesting trend forming for new listings.
We are seeing record setting new listings hitting the market for sale, but do not have the number of sales to absorb them all.
Again, there is a very clear distinction in “months of inventory” between pre and covid era data. Notice that 2025 data is in the middle.
The second chart below is total apartment inventory. We can see this data point tracking along at covid era numbers. This is concerning because the sales data is not matching that era—so the accumulation of inventory is looming.
For all the new listings hitting the market, the absorption rate is holding up at 3 months of inventory—which is currently balanced territory.
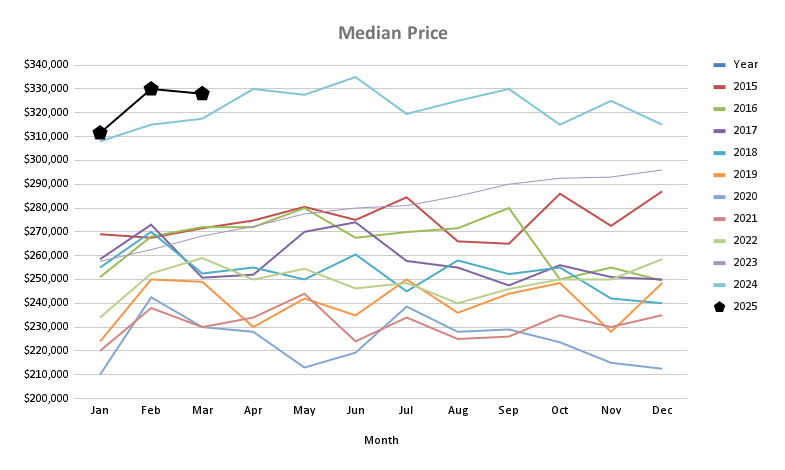
I think the median price is a better metic to track than average because the apartment sales volume is lower than detached units. This helps smooth out any wacky months. Again, a trend to watch.
We are clearly exiting the covid Real Estate cycle as some of the driving forces of our market are easing—primarily inter-provincial migration of people with money to purchase our relatively cheap housing.
Interest rates have cycled, and are well off peak levels but are still high relative to the past 10 years. The majority of Mortgages are renewing into higher interest rates in the next 18 months, which is another pinch on household income statements. And now we layer on employment uncertainty with U.S. tariffs.
Where are the opportunities in Calgary Real Estate then? One idea worth exploring is selling an owner occupied condo, and purchasing an owner occupied detached home.
Another idea would be to purchase a home with a basement suite, or convert the basement to a suite. I’m finding these buildings are in-demand as folks like the additional source of income.
The next Bank of Canada interest announcement is next Wednesday. And man-oh-man is the market fluctuating. The medium term trend for the Bank of Canada is interest rates are forecast lower.
If you’re in a variable rate Mortgage, and you’ve thought about locking into a fixed interest rate, there might be a window of opportunity now. Please connect with me if this is a possibility for you.
I hope this has been helpful!
Talk soon,
Chad Moore
Hey Guys! Tariffs are here. Now what? Tiff Macklem, governor of the Bank of Canada, gave…
Hey Guys! The Bank of Canada publishes "meeting deliberation notes" relating to the discussion of raising,…
When the governor of the Bank of Canada speaks, we listen! Tiff Macklem, governor at…
Let's look back at January 2025 Calgary Real Estate Board (CREB) data to make sense…
Hey Guys! Here's an example of how the Bank of Canada is in a balance…
Hey Guys! Let's look back on 2024, compare it to previous years' and make reasonable…