Calgary Real Estate: Market Update
Below is a Real Estate market summary to help you make sense, understand and predict what might happen in Calgary’s near term Real Estate market.
This information below is based on Calgary Real Estate Board’s (CREB’s) August Real Estate report. I’ve broken out Single Family Detached Housing & Apartment Housing for review.
Three statistics for your consideration are:
1. Sales to new listings ratio.
2. Absorption rate.
3. Average price.
I think understanding and connecting these stats helps wrap my head around any near term price movements.
I think being able to recognize and forecast seasonal trends is helpful and reasonably good context too.
Overall, I think these ratios relate to the basic understanding of supply & demand.
Single Family Detached Housing:
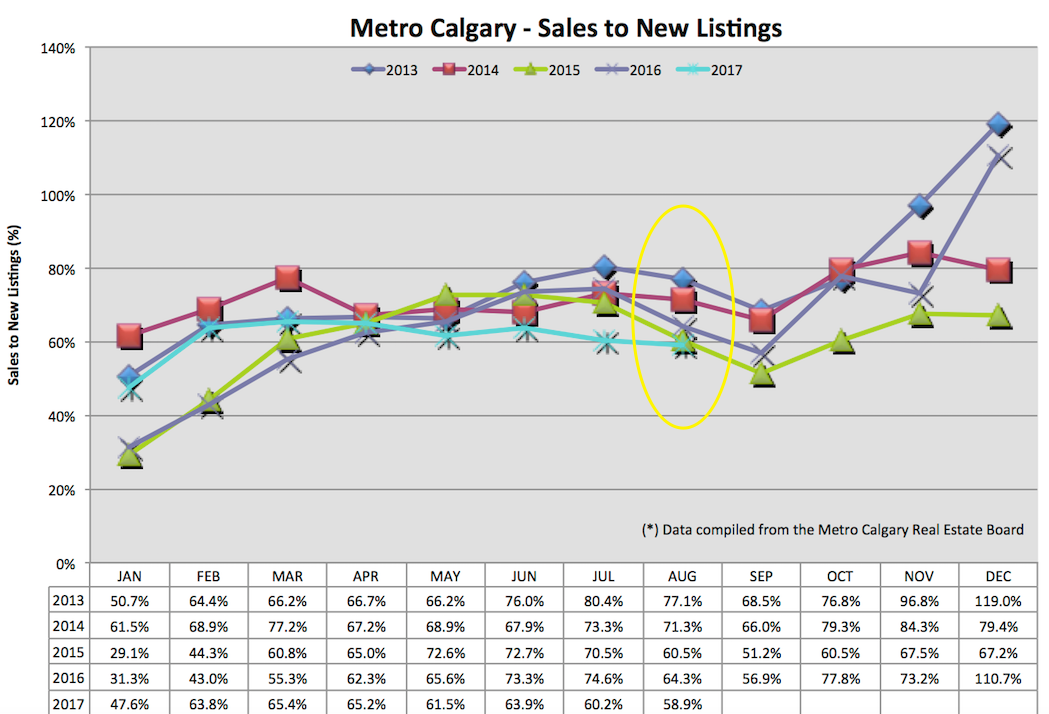
Sales To New Listings Ratio:
This ratio helps us understand how many new listings are entering the market versus homes leaving the market (homes sold). A decreasing data point indicates more and more homes are entering the market. An increasing data point means more homes are selling.
We can see below Calgary’s sales to new listings ratio is slightly down month over month, and year-over-year. The season trend is slightly downward for August and September. I think this is a reasonably tight cluster of data.
Absorption Rate:
The absorption rate tells us, in months, how long it would take to liquidate all inventory, at the pace of this month’s sales. This data point considers sales volume and inventory. Traditionally, between 2-4 months is “balanced” market. Lower numbers indicate a “seller’s” market. Higher numbers indicate a “buyer’s” market.
August’s absorption rate is up month-over-month and year-over-year. This trend is seasonal, but noticeably higher than previous years/months. I think this is due to listing inventory growing close to 10% y-o-y with sales only increasing 0.4% y-o-y.
I think it’s reasonable to think, near term supply is increasing WITHOUT an equal increase to housing demand. This is creating more housing supply and therefore down pressure on housing prices.
Average Price:
The average price is found by taking the total price volume of homes sold and dividing it by the number of homes sold. Grain of salt this data point.
We can see a decrease of month-over-month average price. We DO have an increase in average price year-over-year. Seasonally, the trend line is similar to previous years.
I’m looking for divergent data. I’m keenly watching for reasonable amounts of increasing housing supply. Throughout Calgary’s down turn, relative to the financial crisis of 2008-2010, housing supply has helped prop up Calgary’s housing market.
Calgary’s Apartment Market Data:
Sales To New Listings Ratio:
This data point fell again, m-o-m and y-o-y adding more supply to the market. You’ll notice a drastic contrast between 2014 & 2017. More supply will put down pressure on pricing.
Absorption Rate:
There is more than 7 months of supply of apartments in Calgary. This data point is up m-o-m and y-o-y. Again, you’ll notice a stark contrast between 2014 & 2017 data.
Median Price:
I’m using median price data to help smooth out any volatility of data. There is less apartment volume so data points can swing more intensely, as you can see in the chart below. That said, median price is also down m-o-m and y-o-y. Based on the information we’re reviewing together, I think it’s reasonable to think this trend will continue until there is decreasing supply or increasing demand.
Conclusion:
In Calgary’s apartment market, there continues to be mounting supply that is favouring buyers, in terms of price negotiation. I think apartment sellers need to narrow in on the reality of their price competition when choosing an initial list price.
I’ve been able to help several condo sellers convert their listing into a rental so they can still purchase. This is a sensitive maneuver, not suitable for everyone. Contact me for details.
Calgary’s detached housing market continues to be buoyed with tighter supply. I’m seeing seasonal down pressure on pricing, but nothing to fret.
What is looming is another Mortgage rule change that would restrict conventional Mortgage qualifying. I think this outside market influence would further restrict home purchase demand in Calgary. Without a simultaneous reduction in supply, look for down pressure in pricing. I think staying close to data like this will help any emotion on the subject.
***
Please forward this blog post to those who you think would find this valuable. I appreciate you for that :-)
***
Email or call me with Mortgage/Real Estate questions or concerns.
Thank you for also keeping me in mind as your trusted referral source.
Talk soon,
Chad Moore
P.S
I acknowledge this email is being delivered late into September. I think several of you look forward to this content (or that’s what I tell myself :-)). I’m doing more to plan the beginning of my month to deliver this content sooner.
Recent Posts
Calgary Market Update—March 2025 Data
Here are some Calgary Real Estate numbers, across all property types, out of the gate for…
Interest Rates Up Or Down?
Hey Guys! Tariffs are here. Now what? Tiff Macklem, governor of the Bank of Canada, gave…
Bank of Canada Hot Mic Moment
Hey Guys! The Bank of Canada publishes "meeting deliberation notes" relating to the discussion of raising,…
Banker’s Damaging Admission
When the governor of the Bank of Canada speaks, we listen! Tiff Macklem, governor at…
January 2025 Market Stats
Let's look back at January 2025 Calgary Real Estate Board (CREB) data to make sense…
Mortgage Interest Rate Review
Hey Guys! Here's an example of how the Bank of Canada is in a balance…


