Failing to understand this basic data leaves you susceptible to fear, hype and pressure to purchase at a time that may not be best for you.
This data is critical IF you are thinking about purchasing a home 6-12 months from now. If this is you, join my email list immediately. You cannot afford to miss any of these critical updates.
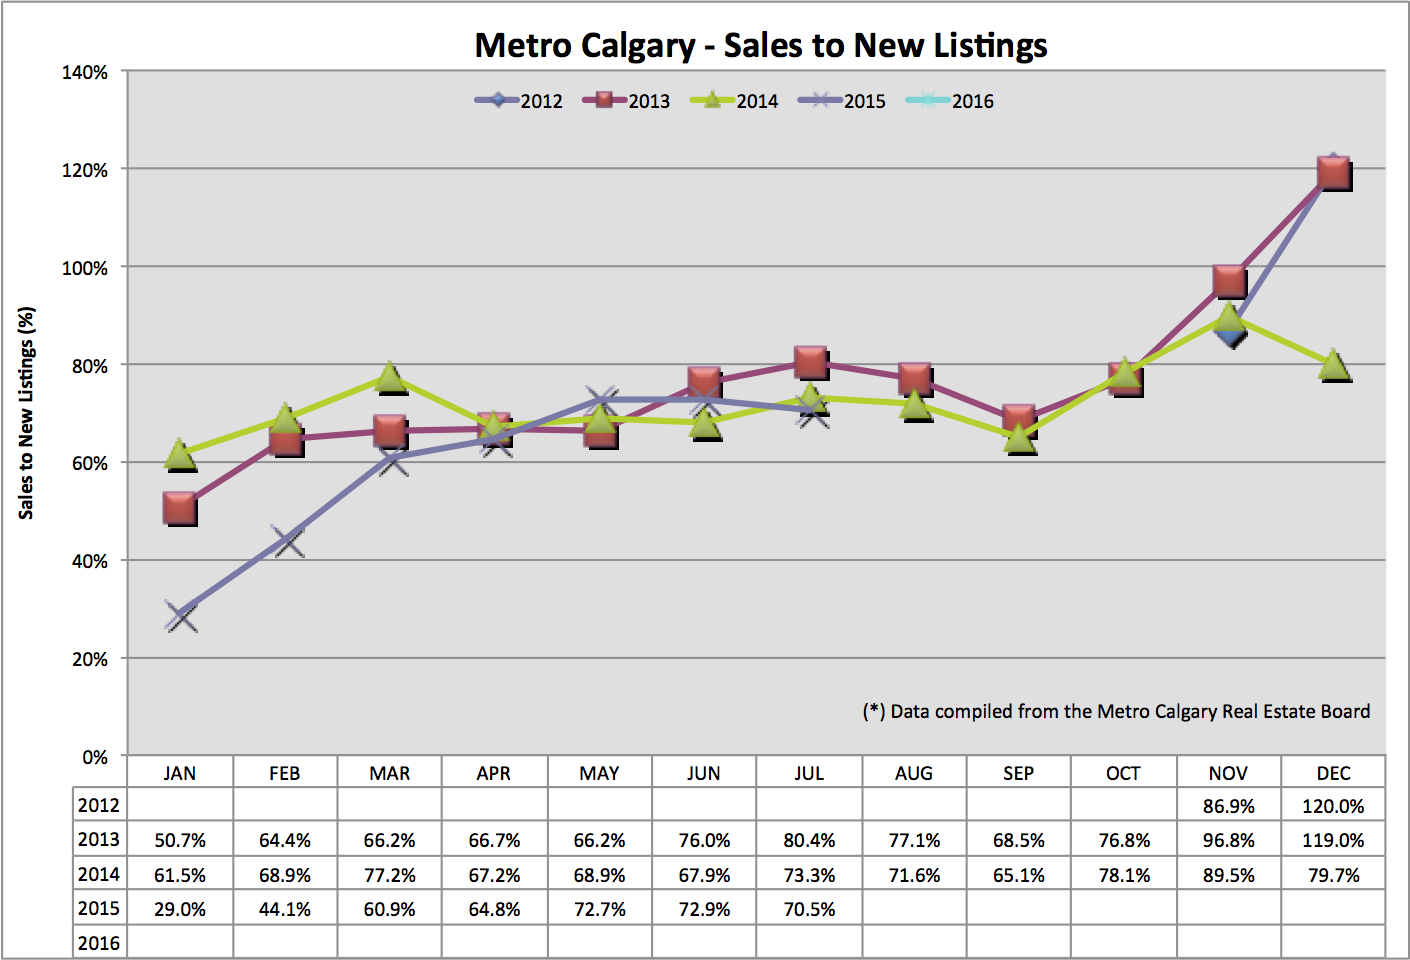
1. Sales to new listing ratio.
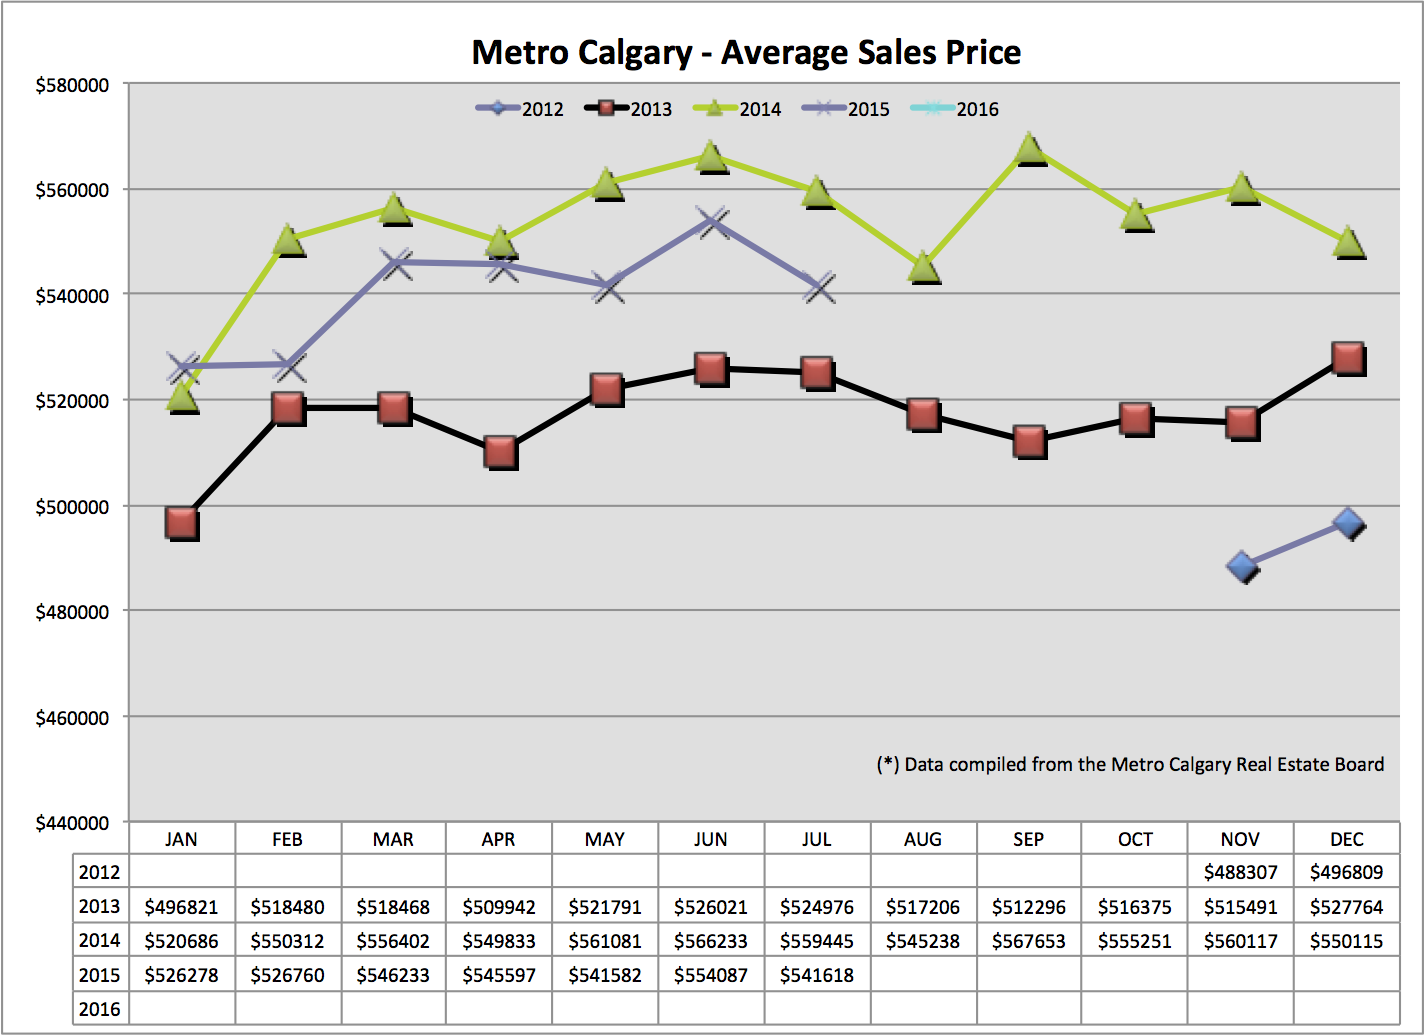
2. Average sale price.
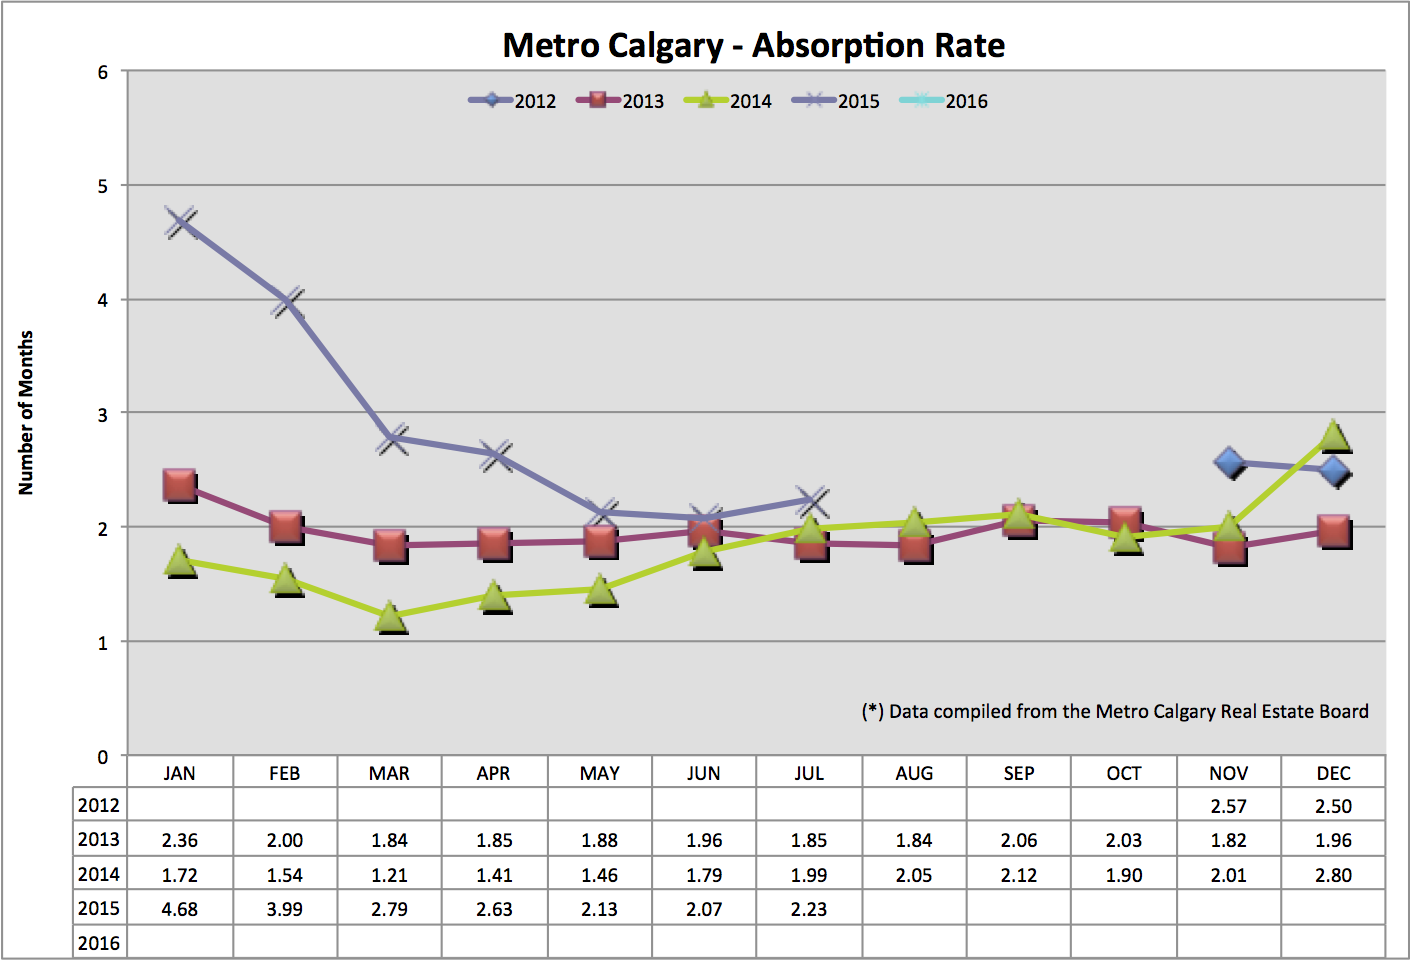
3. Absorption rate.
If you’ve been following this blog you’ll understand that prices are about where we expected them to be several months ago.
I also anticipate home prices to continue to follow the trend of 2014. I think prices will continue to fall throughout August, and flat line in September then seasonally cool again.
The saving grace from even more housing price blood shed is low listing inventory.
Right now we are witnessing the law of supply and demand effect the price of our oil.
High supply, without an increasing demand, creates downward pressure on pricing. Our housing market is also heavily influenced by the laws of supply and demand.
Calgary’s housing market is facing a DEMAND issue right now.
Because the price of oil is down, people are losing their jobs and influencing consumer confidence of those who may qualify to purchase a home. If we were also facing high housing supply in Calgary – look out.
They help us ANTICIPATE what may happen to housing supply and offer us a window into month over month and year over year comparisons.
I frequently send updates to my list of email subscribers, along with blog post notifications. You may wish to join my inner circle here.
On to the data now …
This tracks, as a percentage, the number of homes sold relative to the number of new listings coming into the market.
A ratio of 100% means for every new listing on the market a home sold.
July’s sales to new listing ratio is slightly down month over month AND year over year.
We are adding more listings to the market, relative to last month and last year. Continue to watch this number to anticipate future supply levels.
This statistic, tracks in months, how long it would take to sell ALL of Calgary’s single family detached listing inventory, at the pace of this months sales.
Between 2-4 months is a balanced market. Lower absorption rates indicate a sellers market. This indicates relatively strong sales with lower inventory levels
High absorption rates indicate a buyers market. Meaning, there is more listing inventory and less sales each month which creates downward pressure on pricing.
July 2015 marks the first month this year that the absorption rate is INCREASING which indicates a move towards a “buyers market”. This statistic is up year over year and month over month.
We are seeing a lower sales to new listing ratio AND a higher absorption rate. This is an indication of down pressure on home prices.
We can see a definite trend matching 2014 sales data. I think August average sales price is going to seasonally match August of 2014, following this trend for another month.
Based on historical data, purchasing in the summer or winter are, seasonally the best times. If we qualify “best” as meaning the lowest prices of that particular year.
However, if you are in the mindset of “wait and see” I encourage you to read my previous blog post here.
I think defining what you are “waiting to see” will help you plan to make a strategic home purchase.
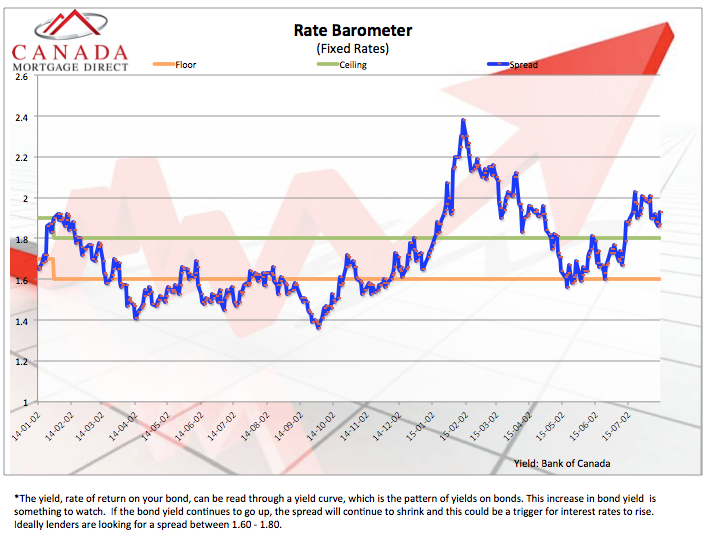
Fixed interest rates are derived from the bond market. Mortgage lenders increase or decrease fixed interest rates based on the spreads they make.
Below you’ll find my Interest Rate Barometer. Within this image you’ll note the blue line. This line is the spread Mortgage lenders are currently earning in the market.
When the blue line is within the comfort zone (green and orange horizontal lines) or above, there is actual downward pressure on interest rates. In this environment, interest rates may decrease, which is what we are seeing today.
I am fielding email and telephone questions from people interested in fundamental advice. This ranges from people looking to purchase OR renew their Mortgage. Before you call, just make sure you are working and have good credit :-)
You may email or call me from below.
Talk soon,
Chad Moore
403-809-5447
chad at canadamortgagedirect.com
P.S
If you find this content educational and something you would like to see more of, please click the “Like” button at the top of this post. Thank you in advance!
P.P.S
If you plan on purchasing a home in the next 6-12 months I would like to speak with you. Please fill out my contact form available to you here. 100% no risk. 100% no obligation. I am earning your business.
Here are some Calgary Real Estate numbers, across all property types, out of the gate for…
Hey Guys! Tariffs are here. Now what? Tiff Macklem, governor of the Bank of Canada, gave…
Hey Guys! The Bank of Canada publishes "meeting deliberation notes" relating to the discussion of raising,…
When the governor of the Bank of Canada speaks, we listen! Tiff Macklem, governor at…
Let's look back at January 2025 Calgary Real Estate Board (CREB) data to make sense…
Hey Guys! Here's an example of how the Bank of Canada is in a balance…