What word comes to mind when you see Calgary’s average detached price below? My jaw dropped!
Each month I like to review Calgary Real Estate Board (CREB) statistics to note a couple key pricing indicators:
1. Sales to new listings ratio.
2. Absorption rate.
3. Average/median price.
These housing supply data points, along with understanding some fundamentals about Real Estate demand, help me anticipate near term movements in price.
I think this is helpful to understand if I’m a homeowner, or someone considering making a home purchase.
CREB Data:
Detached Housing Data:
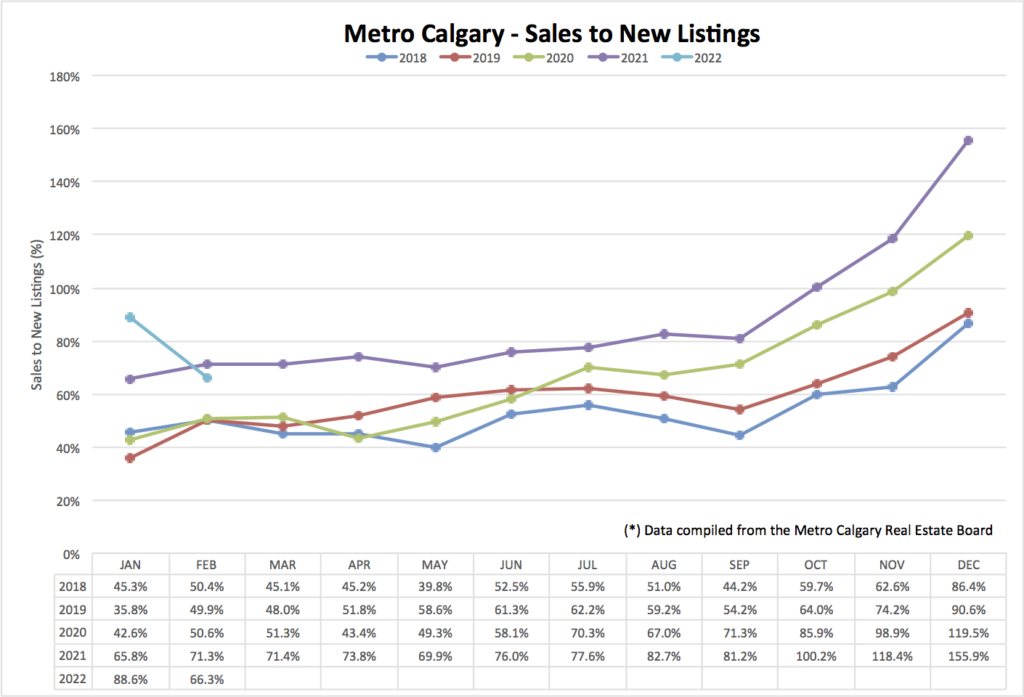
Sales to new listing ratio:
This data point helps me understand the relationship between homes exiting the market and home entering the market.
Here’s how to interpret this graph: A ratio of exactly 100% indicates that for every new listing that entered the market, a home exited. A ratio less than 100% indicates a build up of inventory.
I published content, mid February on LinkedIn, that the market can’t blame a lack of listing inventory as the “problem”. Listing inventory dog-piled onto the market at an incredible rate, trying to help balance pricing. Calgary’s detached homes have insatiable purchase demand right now.
New listings February 2021: 1,572
New listings February 2022: 2,874 (82% increase).
For context, back in May-June 2017 was the last time Calgary’s detached market saw more than 2,000 new listings hit the market in one month. Remember those economic conditions in Calgary? We had cratering oil, massive lay offs, tightening monetary policy, tighter Mortgage qualifying etc. Scary times.
Absorption rate:
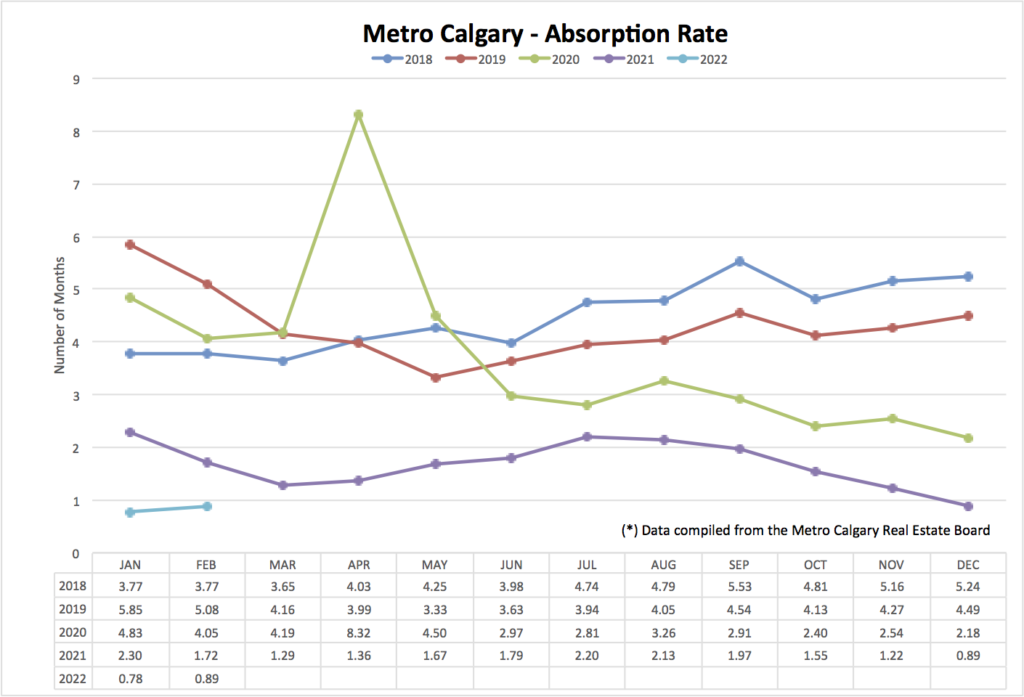
Absorption rate indicates how many months it would take to sell all current listing inventory, at the pace of that months sales volume. A balanced market is between 2-4 months. Lower absorption rates favor the seller.
Here we are, below 1 month absorption. For buyers, this is a crisis market. I’ve been in the trenches seeing how competitive, aggressive, and ruthlessly swift this market is. You guys have have heard the stories about sale-to-list price ratios …I’m still seeing that in our market.
Check these stats out:
Sales February 2021: 1,121 homes.
Sales February 2022: 1,905 homes (up 69% y/y).
Average Price:
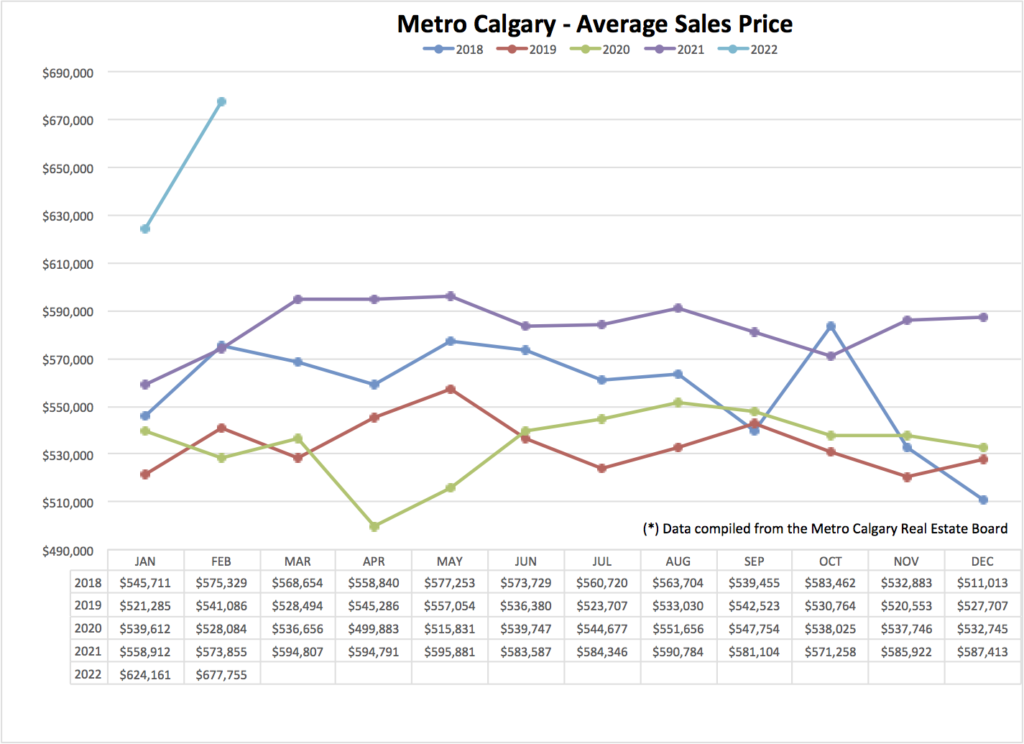
Does your jaw drop seeing this chart? Mine did.
Is this our new normal? Do our housing price expectations increase to this level and we are all OK and agree this is just the price of homes now? I wish I knew.
I find the market market loves to play the blame game and point fingers around at who’s fault this is. The general “blame” now is on buyers from Ontario and B.C. cashing out and buying Calgary Real Estate. That IS happening, and I’m ok with it.
If I step back and look even more broadly at Canada’s housing market, which is tied to our long-term economic cycle, several cause-effect pieces of the puzzle come together, which is much more than I am writing you about today. As always, I do the best I can in the circumstances I’m faced with.
Apartment Data:
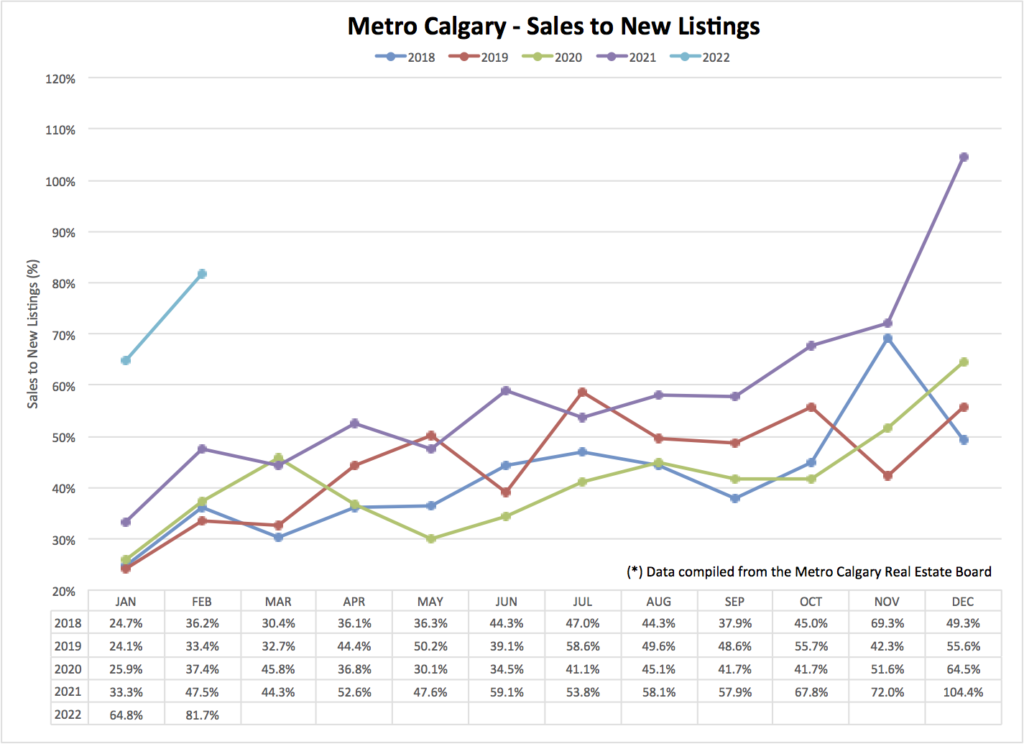
Sales to new listings ratio:
Apartments! This segment continues to improve with each passing month. More and more inventory is bought up, reducing supply to steady prices.
Several sources are reporting that Ontario investor groups are coming into our market in droves, buying up apartment units.
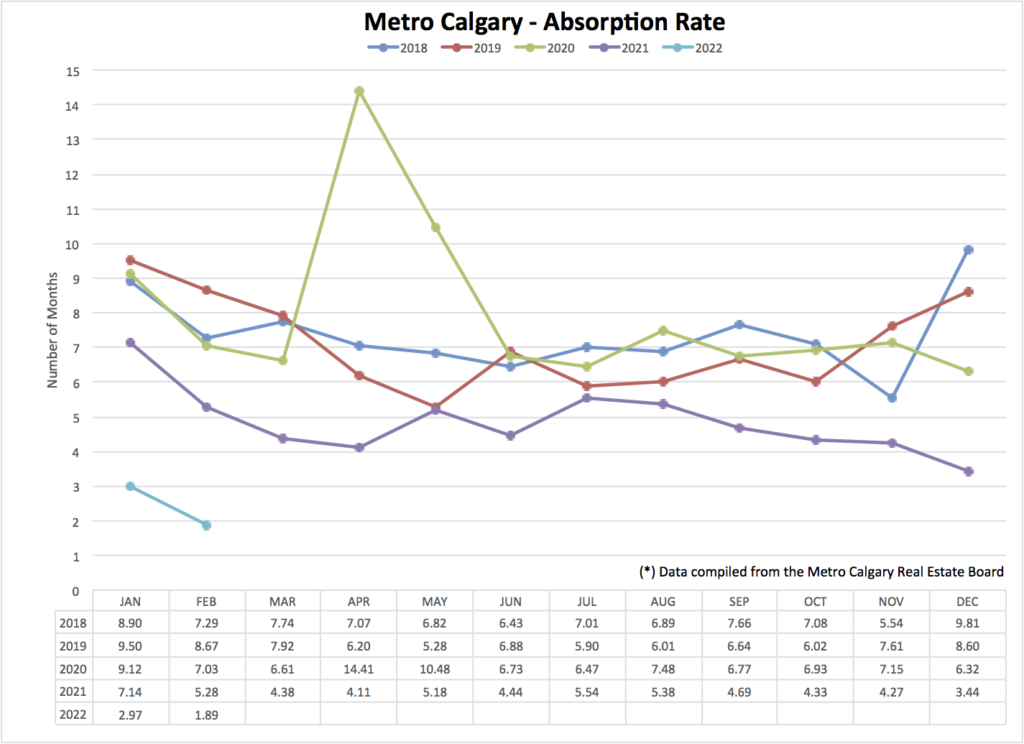
Absorption rate:
Apartment absorption rate continues to turn around! As prices of other Real Estate types rise (i.e., detached and attached homes), lower priced apartments become more favorable.
I’m noticing Calgary’s core growing to be more accommodating to everyday life with grocery stores, and other amenities near by. Our economy opening up might draw more people back to the core as well.
Median price:
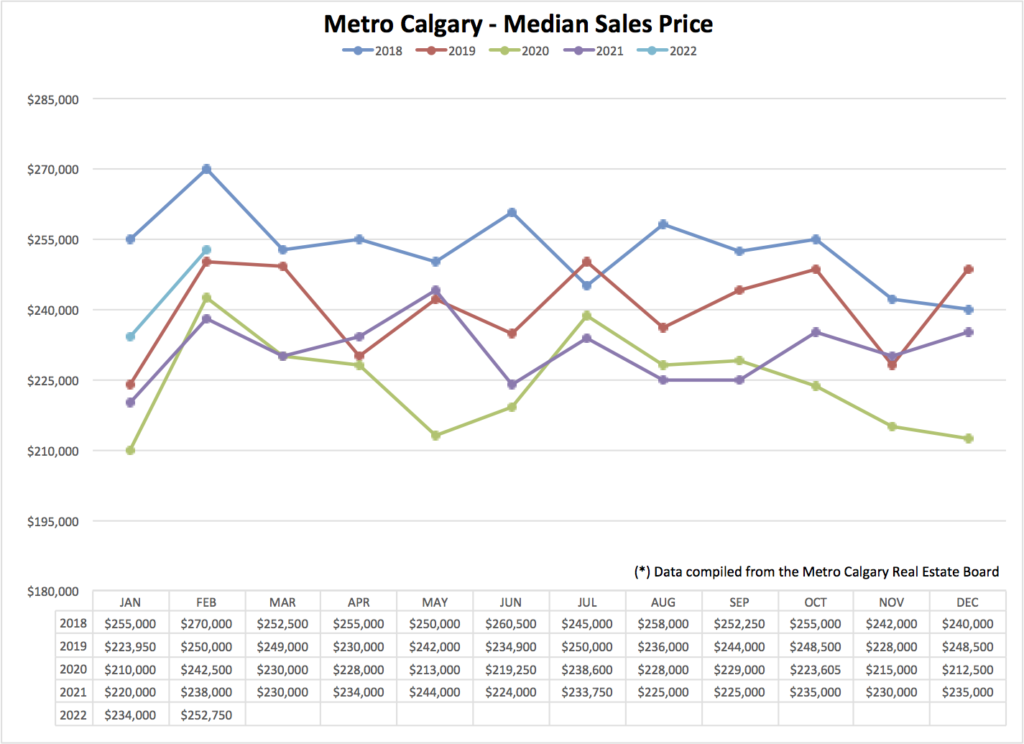
I think the building blocks are in place for apartment median price to continue climbing.
Conclusion:
Demand for Calgary homes has undoubtedly pulled out bearish home buyers, pulled forward future home buyers, and is now pulling buyers in from all corners of Canada. What an interesting time!
One small step toward dampening home purchase demand was taken earlier this week with the Bank of Canada raising interest rates 0.25%. However, monetary tightening or loosening of credit take about 12-18 months to show up in the Real Estate market.
For example, remember July-August 2020? The full pandemic response had been announced, with the governor of the Bank of Canada begging Canadians to go and borrow money – providing forward guidance that “rates will be low for a long time”. And here we are, about 18 months later with a dizzying Canadian Real Estate market.
I hope this content is helpful for you. If so, send it over to one of your friends who’s either buying or selling. Tag me in that email.
Do you have questions? Reply to this email and I’m getting back to you!
Talk soon,
Chad Moore

