Calgary Mortgage February 2016 Market Update
Below is a statistical round up of important Calgary Real Estate Market Statistics to help you make sense of our current housing market.
These stats help you:
- Anticipate future housing supply.
- Anticipate future home prices
- Anticipate future fixed interest rates.
- Understand how housing supply and current sales work together.
If you like the context of this information, please consider sharing it with others who might value it too. Thank you in advance.
I do all of this to earn your trust, and future business as a Mortgage professional. If you are considering purchasing a home in the next 6-12 months contact me for the following reasons:
- Learn how to shop around for your Mortgage, intelligently. Yes, I actually help you shop around for a Mortgage with your Bank or other Mortgage brokers.
- Learn how to save money, where the Banks actually make less. Yes, it’s true, I help you save money, on top of getting you the best interest rate. Ask me how!
- Access various programs you might not have considered before: customizing your home with the Banks money and a “price guarantee” (coming soon).
On to the stats …
Calgary Mortgage Market Statistics
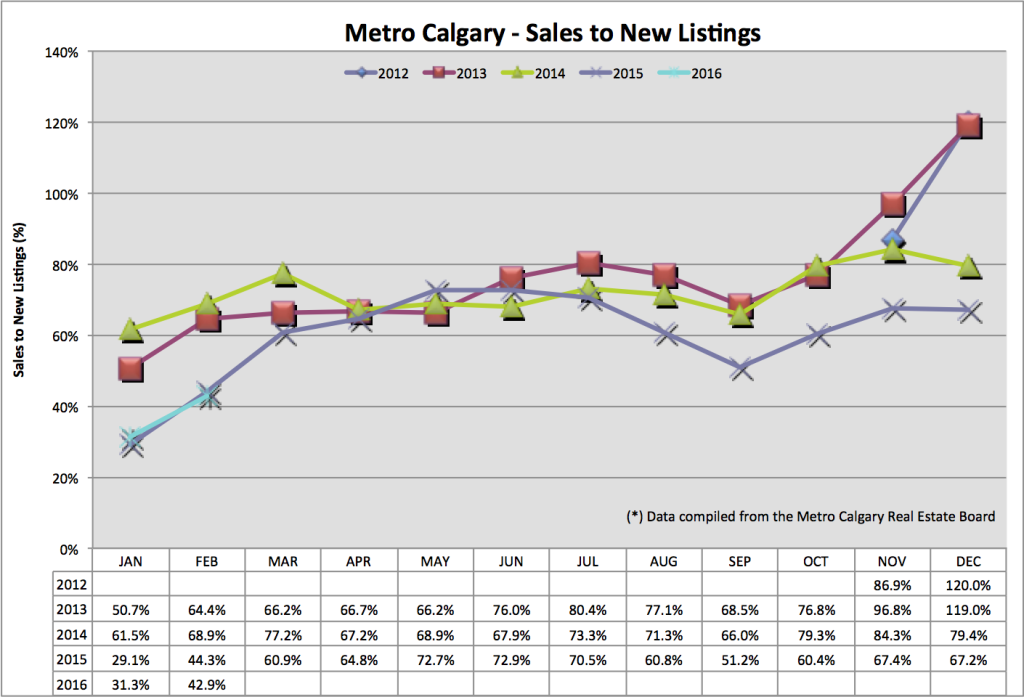
Sales To New Listings Ratio:
This ratio considers the number of sales (homes leaving the market) compared with the number of new listings (homes entering the market). This helps us anticipate future housing supply. As you know, home prices are a result of supply and demand economics. This ratio helps us anticipate the supply side of our housing market. For context, the lower the percentage of the sales to new listings ratio the MORE future listings are hitting the market.
Absorption Rate:
The absorption rate tells us in months, how long it would take to liquidate ALL of Calgary’s single family housing inventory, at the current pace of sales in February.
A balanced market is typically somewhere between 2-4 months.
You can see in February 2016 we are above the 4 month threshold, down month over month but slightly up year over year.
Based on our current absorption rate and sales to new listings ratio, I see a similar path developing as the first half of 2015.
I also continue to anticipate downward pressure on home pricing because of these statistics. I think it is also worthy continue to watch Calgary’s employment numbers and net migration to the city, as these are primary drivers of the demand curve for Calgary Real Estate. Based on my understanding, Calgary continues to face decreasing demand for housing too = additional down pressure on pricing.
Average Price:
Seeing this number is was an initial relief to me, until I looked into the actual home sales.
For context, the average price of ANYTHING can be skewed by top end numbers, or lack thereof. I think there were several luxury homes sold in February 2016 – over two million dollars – that propped up the average sale price.
That said, WITHOUT those two sales, I don’t think the average sales price would be as catastrophically low as I think potential home buyers might be thinking.
Interest Rate Barometer:
The blue line in this graph show the spread of interest rates on the bond market and the Mortgage market.
The higher the blue line means high Bank profits and an indication that rates might decrease.
A low blue line means low Bank profits and is an indicator interest rates might increase.
In Conclusion …
I think there are two fundamental pillars people stand on when thinking about entering the housing market.
- Stability in resale home values (housing market).
- Confidence in future income potential.
If either of these pillars are not rock solid, or worse, people think BOTH pillars are threatened, naturally the decision to purchase a home is not an option.
And here in lies the opportunity for those of you who have confidence in your employment! Gain an understanding of your home affordability (by speaking with me) and the specific market you’re interested in. You might find different markets/areas/price ranges offer you price stability so you have TWO solid home buying pillars to stand on.
Thank you for your time reading! Please remember to click “Like” above and share this article.
Talk soon,
Chad Moore
Recent Posts
Calgary Market Update—March 2025 Data
Here are some Calgary Real Estate numbers, across all property types, out of the gate for…
Interest Rates Up Or Down?
Hey Guys! Tariffs are here. Now what? Tiff Macklem, governor of the Bank of Canada, gave…
Bank of Canada Hot Mic Moment
Hey Guys! The Bank of Canada publishes "meeting deliberation notes" relating to the discussion of raising,…
Banker’s Damaging Admission
When the governor of the Bank of Canada speaks, we listen! Tiff Macklem, governor at…
January 2025 Market Stats
Let's look back at January 2025 Calgary Real Estate Board (CREB) data to make sense…
Mortgage Interest Rate Review
Hey Guys! Here's an example of how the Bank of Canada is in a balance…


