Chad’s Market Commentary:
As the price of oil continues to slowly increase, I think more and more people are going to peak their heads out from underneath the covers of their bed, look around, and decide if “everything is OK”.
Despite oil’s marginal increase, unemployment continues to be a stress in Alberta and Calgary’s economy. And this certainly trickles into effecting the supply and demand of Calgary’s Real Estate (see stats below).
That said, I think people anticipated A WORSE scenario than where we are today. And I think these same people predict A LOT worse to happen in the future.
I am still cautiously optimistic about Calgary’s housing market. Why? Because I am anticipating the markets reaction to severance and employment insurance money ending for some of the job loss casualties in AB.
Certainly some people are going to be effected by this circumstance. To the extent that these people NEED to sell their homes for money is a story line worth closely watching.
I am looking for signs of this NEED in the stats below (clue: I don’t see anything yet!).
Ok, below are three important statistics help us predict the near term future of Calgary’s Real Estate prices. I’ve also added in my interest rate barometer to anticipate near term fixed interest rate increases.
Below are these statistics, the data and how I interpret everything.
Sales To New Listings Ratio:
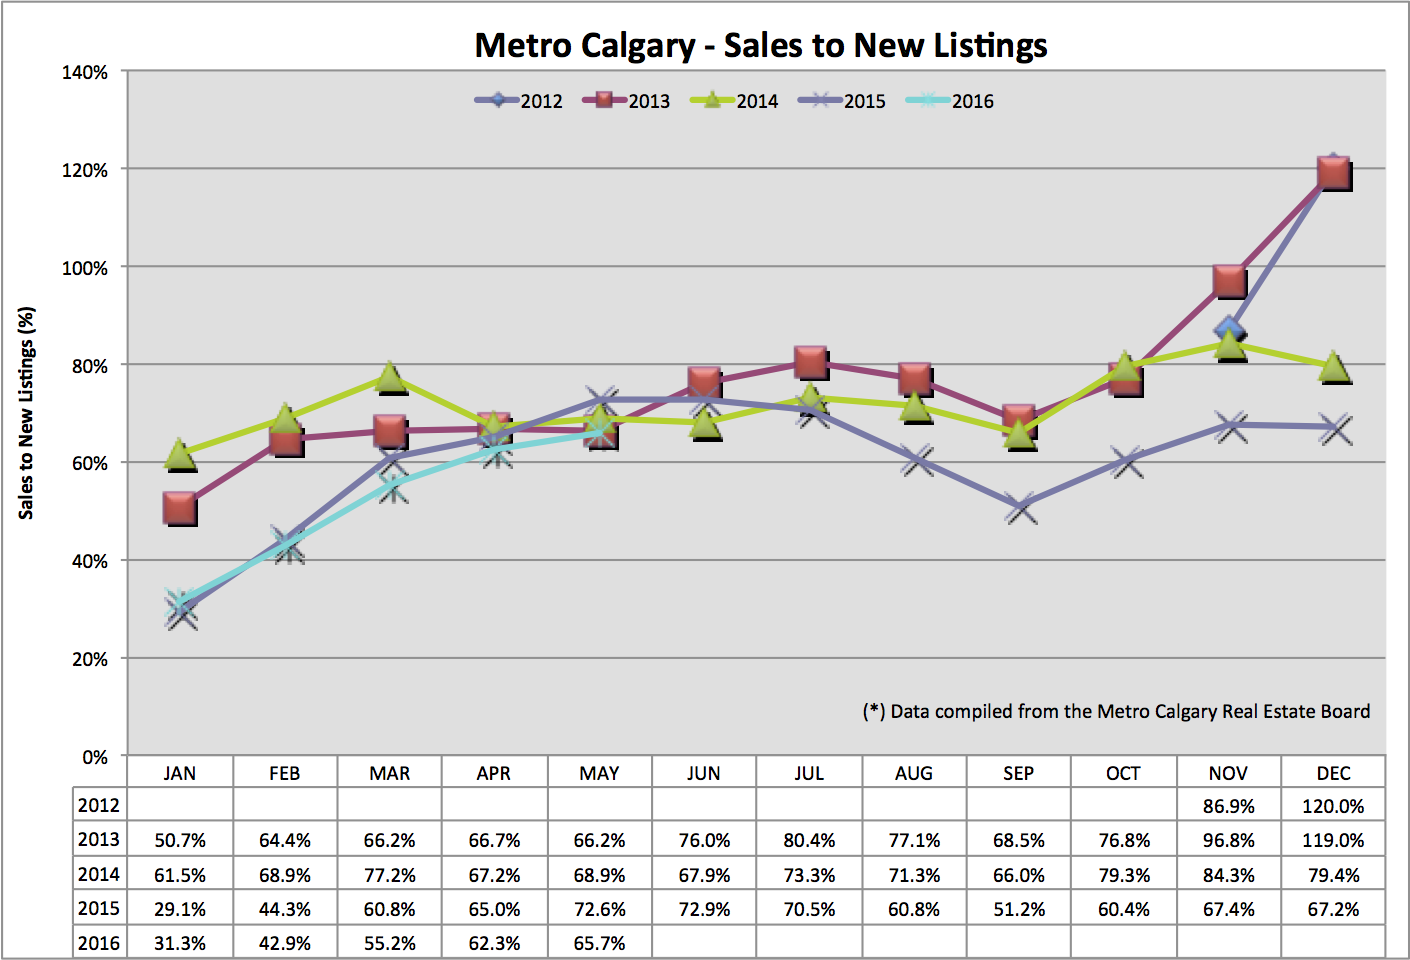
This ratio helps me anticipate future supply level’s of single family homes for sale.
This ratio factors in how many new listings are coming onto the market, compared with the number of homes leaving the market (sold homes).
A decreasing ratio means more and more homes are entering the market, net of homes being sold.
Our June 2016 data is nearly following in lock-step with 2015. This data point indicates decreasing anticipated inventory levels, month over money.
This data point is also about the same as the previous three years. I don’t see anything coming to significantly knock our market off course – in either direction.
Absorption Rate:
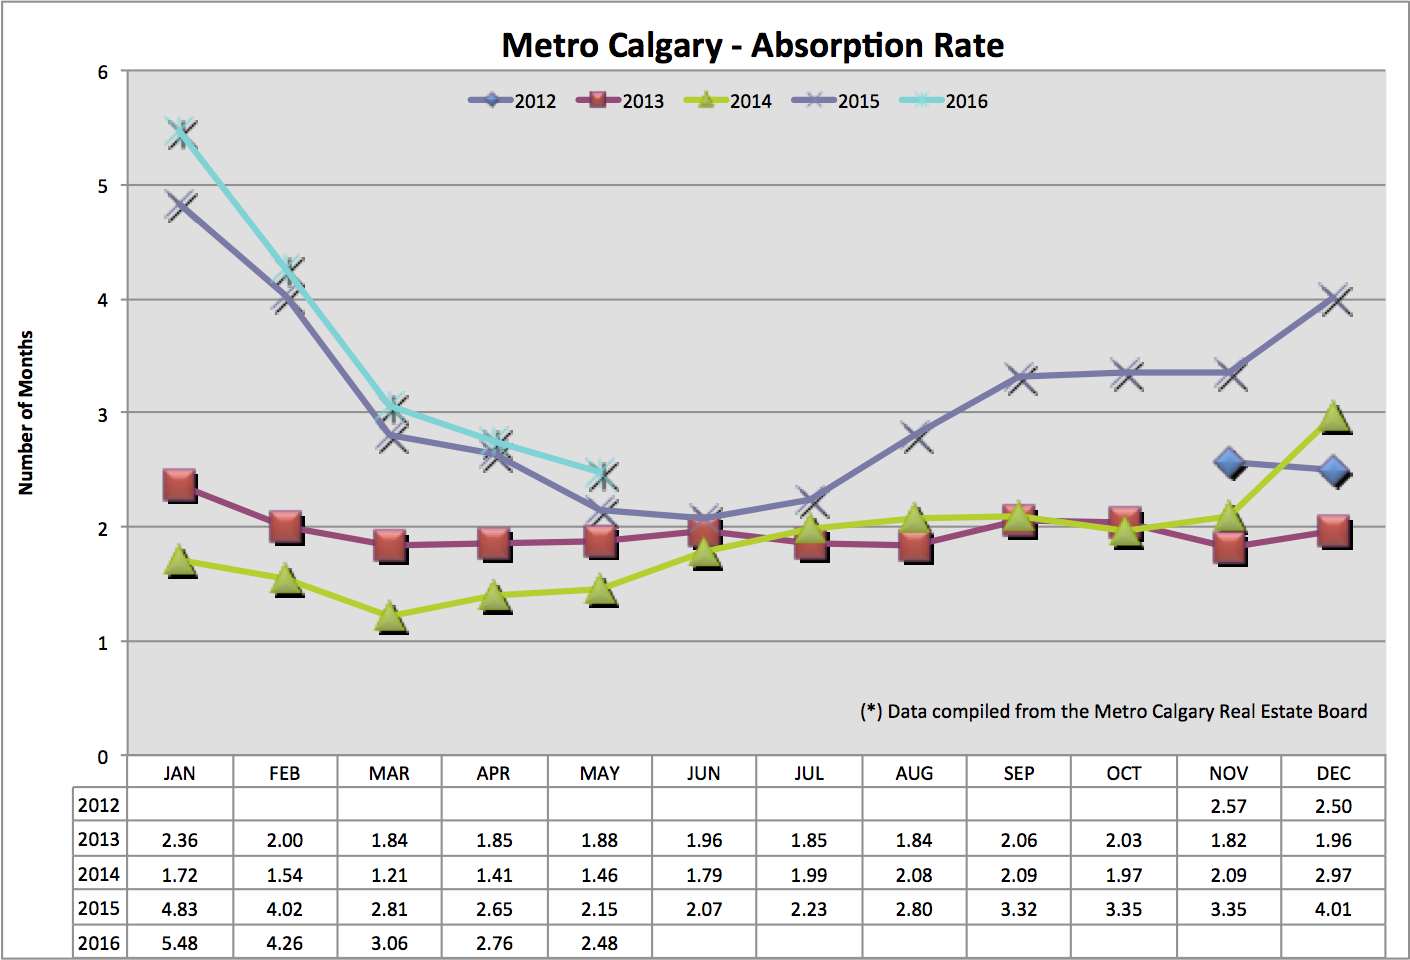
This ratio tells us, in months, how long it would take to liquidate ALL of Calgary’s current single family homes for sale, at the pace of this months sales.
A balanced market is traditionally between 2-4 months. As you can see below, we are technically in a balanced market. Remember, each area, price range, home style etc functions in micro-markets throughout Calgary.
I am also noticing our absorption rate to be up year over year showing slightly higher inventory levels and slower sales volume.
Average Sale Price:
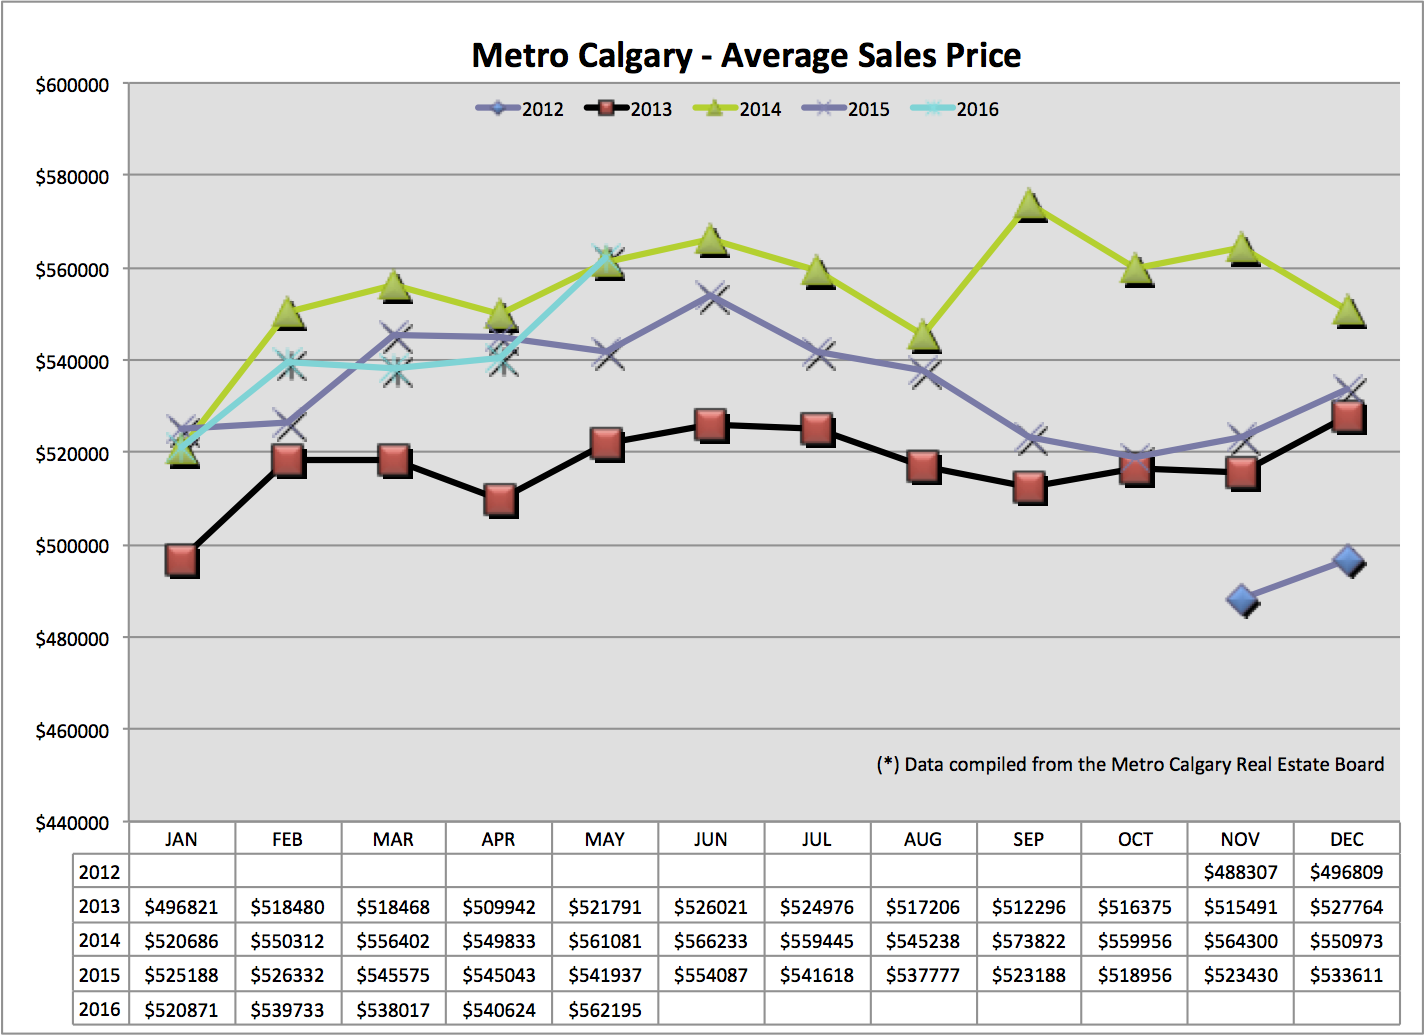
The average sales price of a single family home helps us put into context some price movements, up or down, on a City wide basis.
Remember, the average can be skewed either way, by the addition or lack of, large ticket homes sold.
Rate Barometer:
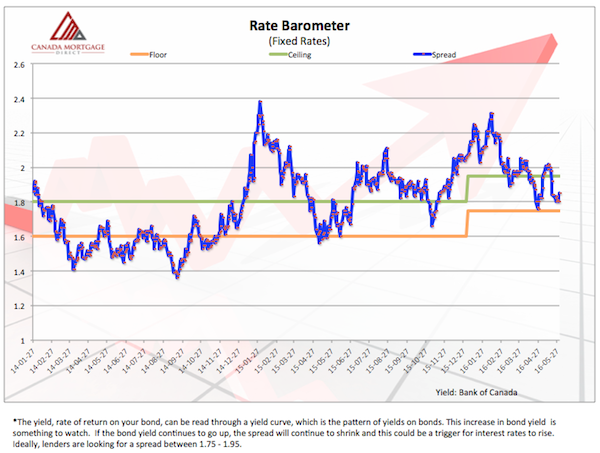
Fixed interest rates are derived from the Canadian bond market. Therefore, tracking the bond market helps anticipate Mortgage interest rate movements.
I am not seeing any sudden reason for there to be increasing interest rates in the near future.
Conclusion:
I really look forward to my next newsletter mail out, which I am moving to quarterly distribution.
I plan on increasing the quality of my content and asking other industry professionals to contribute TO HELP YOU MORE!
Continue to keep a close eye on these statistics. I find the sentiment to be quite negative around the thought of Real Estate still in Calgary.
Overall, I think there are economic challenges ahead, but with that comes opportunities.
Thank you again for your kind referrals and please, let me know how I can help you!
Talk soon,
Chad Moore


