March Real Estate Statistics
The statistics you are viewing below offer an insight into FUTURE price directions in Calgary.
I think MANY potential home buyers in Calgary are “waiting to see” where prices are headed. The statistics you are privy to, offer an insight into where these prices MAY trend. Continue to keep close.
I think the obvious leading indicator of home prices, and more importantly buyer confidence, is the price of oil. In addition, other leading indicators to ANTICIPATE home prices is housing supply, net migration to Calgary and employment numbers.
I track these statistics to earn your future business and referrals from friends family and co-workers.
If you are thinking about purchasing a home in the next 6-12 months, I think positioning yourself TODAY for that future event is wise.
I help all of my clients save time in their home search by narrowing down EXACTLY how much you can afford. I also help you save money by finding you the best terms, conditions, interest rate AND long-term Mortgage STRATEGY – specifically for you.
Please visit this link to learn how much you can afford today so you can smoothly purchase your new home tomorrow.
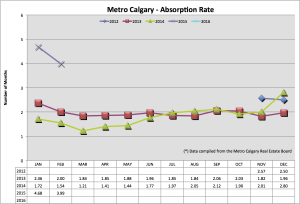
Absorption Rate:
The absorption rate is a statistics measured in months indicating how long it would take to sell our current home listing inventory, based on the pace of sales currently happening. Historically, a balanced market is between 2 and 4 months. Year over year, our absorption rate is up and seasonally trending down. I like this statistic because it offers an insight into total listing inventory and this months sales pace.
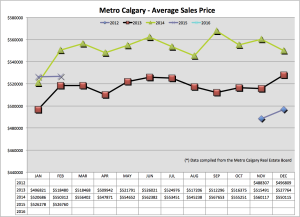
Average Price:
Average price is fairly basic as it is the total amount of detached Real Estate sold in Calgary metro area divided by the number of units sold. A major factor to this statistic fluctuating is more or less high end homes sold during any particular month. Month over month we are even but down year over year.
Sales To New Listings Ratio:
Find this number by dividing sales into new listings added, for any particular month. This number decreases with any combination of less sales per month and or increasing new listings added. Year over year, BOTH sides of this ratio changed causing it to be lower.
Recent Posts
Calgary Market Update—March 2025 Data
Here are some Calgary Real Estate numbers, across all property types, out of the gate for…
Interest Rates Up Or Down?
Hey Guys! Tariffs are here. Now what? Tiff Macklem, governor of the Bank of Canada, gave…
Bank of Canada Hot Mic Moment
Hey Guys! The Bank of Canada publishes "meeting deliberation notes" relating to the discussion of raising,…
Banker’s Damaging Admission
When the governor of the Bank of Canada speaks, we listen! Tiff Macklem, governor at…
January 2025 Market Stats
Let's look back at January 2025 Calgary Real Estate Board (CREB) data to make sense…
Mortgage Interest Rate Review
Hey Guys! Here's an example of how the Bank of Canada is in a balance…


