Good, Bad or Ugly I’m presenting this data to you. Have been for close to three years now.
I think understanding three data points helps you make sense of today’s market and anticipate near term price movement (without hype).
Data we’re considering:
1. Sales to new listings ratio.
2. Absorption rate.
3. Average price.
This is all from the latest Calgary Real Estate Board (CREB) data here. I think this is helpful for you because this help anticipate near term housing supply. Read a recent blog post of mine speaking to Real Estate demand here.
Detached Housing Market:
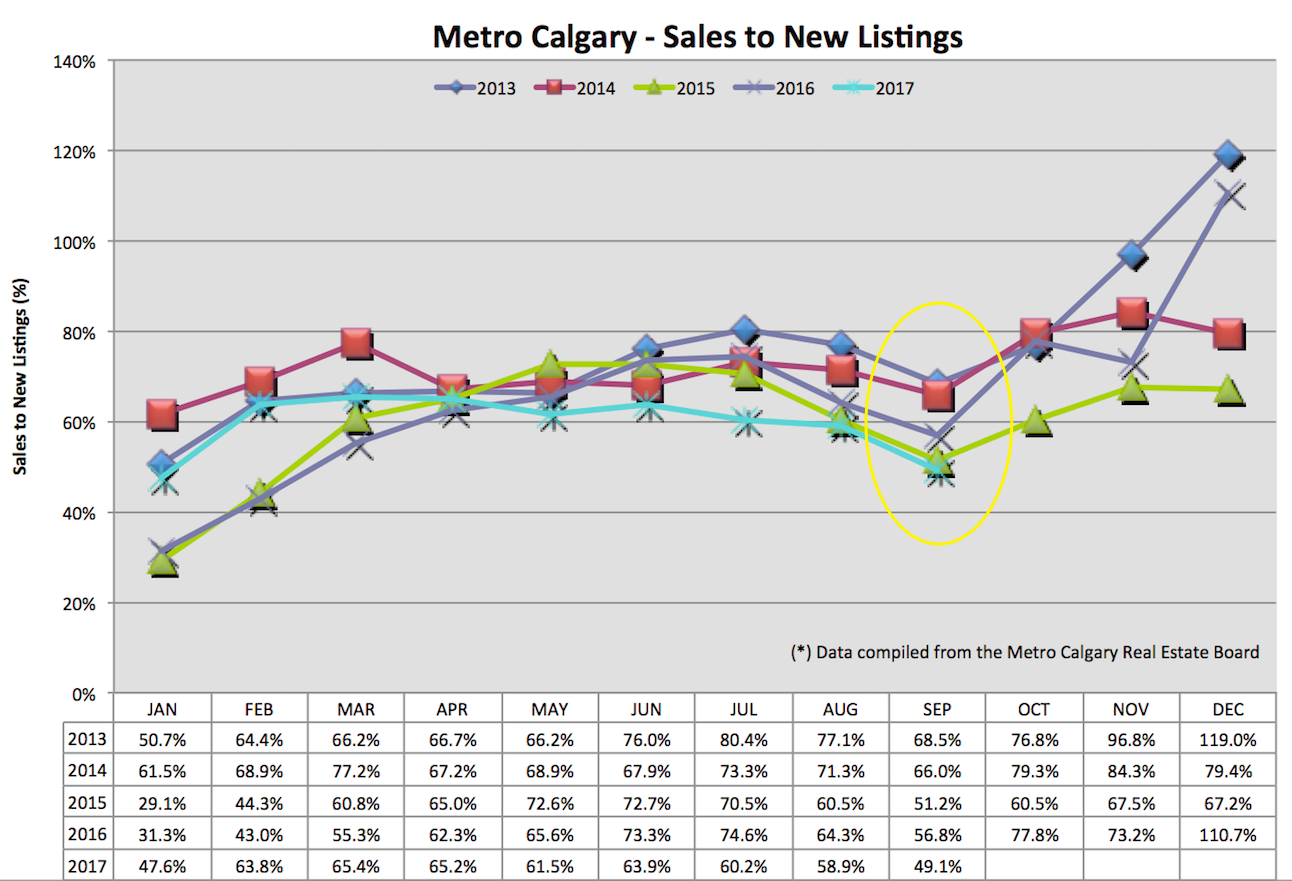
Sales To New Listings Ratio:
This ratio combines the data of new homes coming onto the market (new listings) with data of homes leaving the market (sold listings). The lower this ratio dips, the stronger the data supports more listing inventory coming onto the market. This increases supply. Without an equal increase of housing demand, I think there is downward pressure on prices.
The latest sales to new listings ratio is down month-over-month and year-over-year.
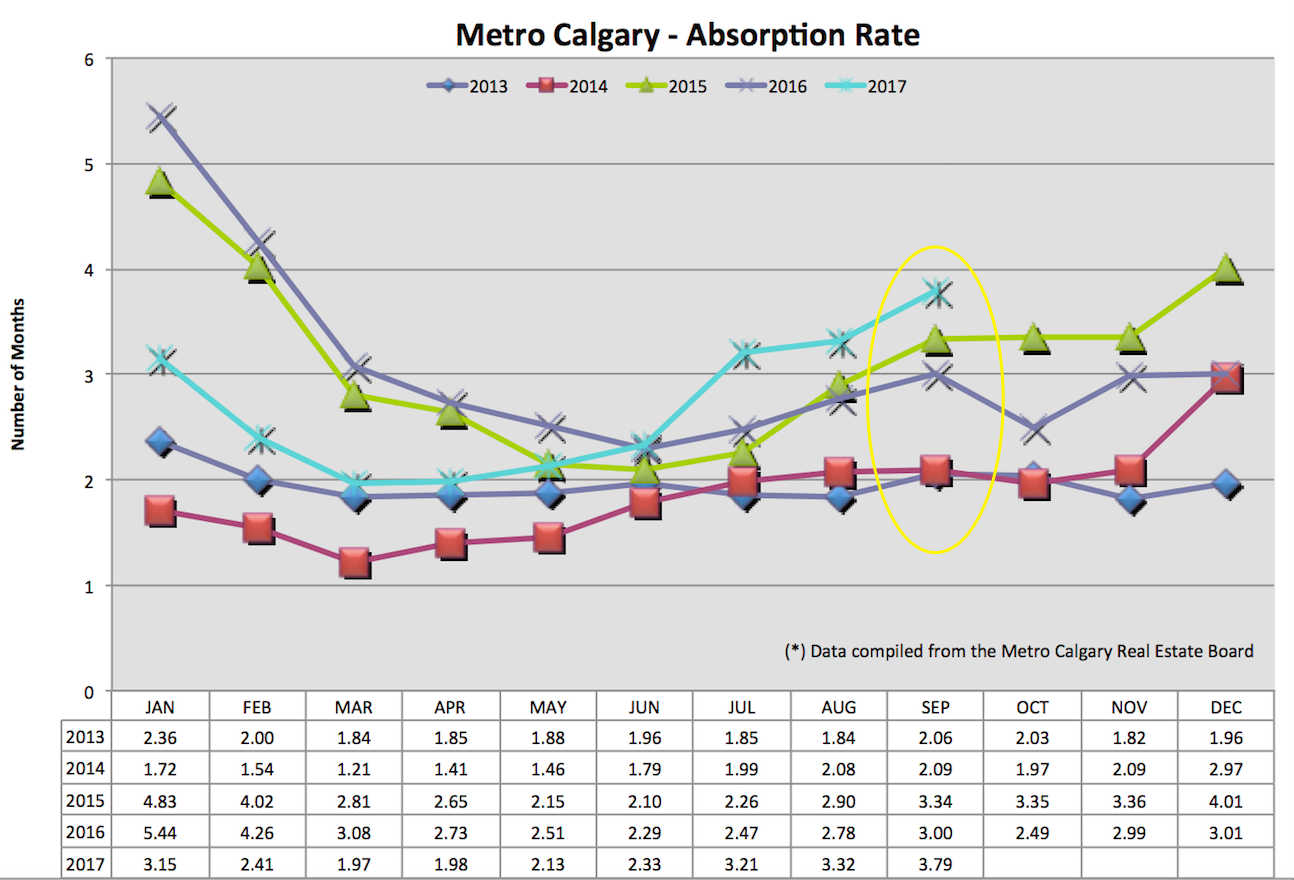
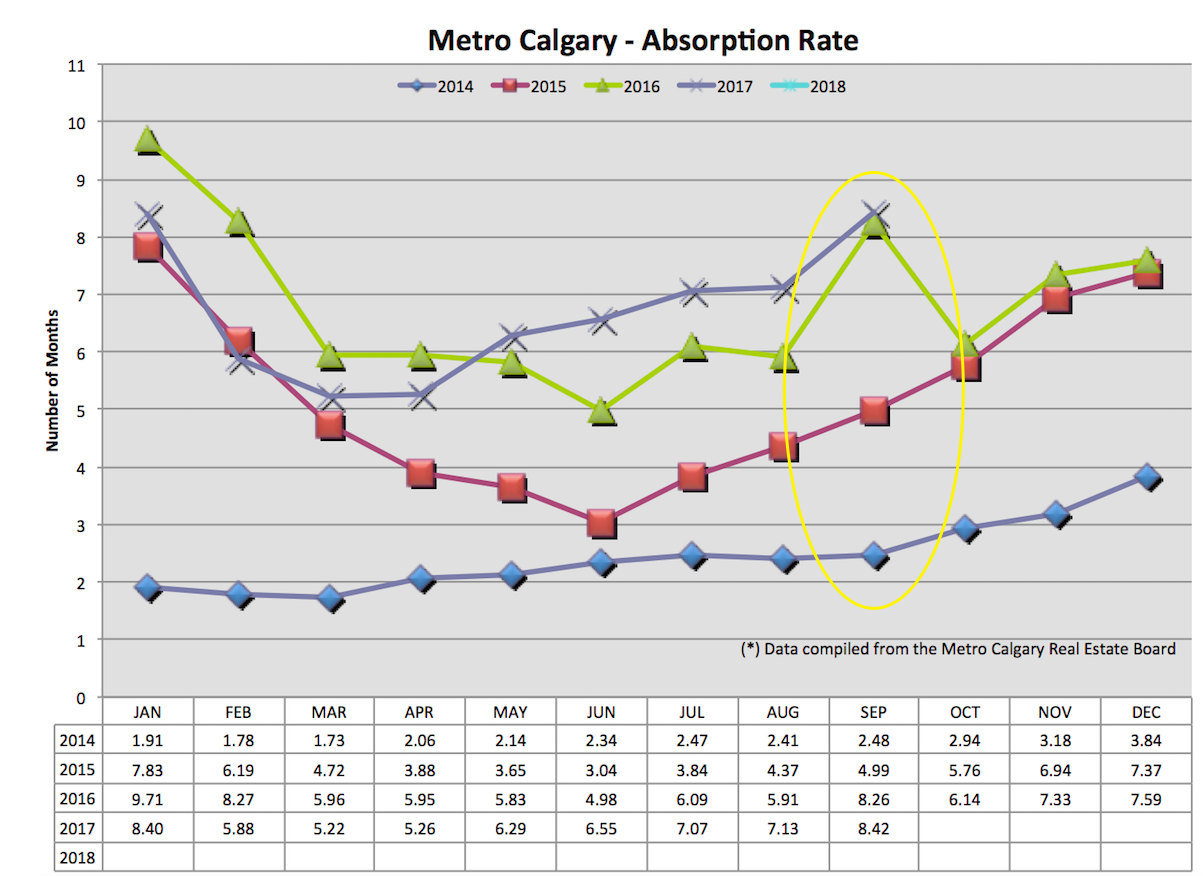
Absorption Rate:
This ratio combines the latest sales and inventory numbers together so we have a sense of how long it would take to liquidate all home listing inventory at the pace of the current month’s sales. For context, a balanced market is between 2-4 months. Lower absorption rate data indicates a “sellers” market, with upward pressure on pricing. Higher absorption rate data indicates a “buyers” market, with downward pressure on pricing.
I see Calgary’s absorption rate increasing month-over-month and year-over-year. Without an increase of sales, more listing inventory is set to push this data point higher.
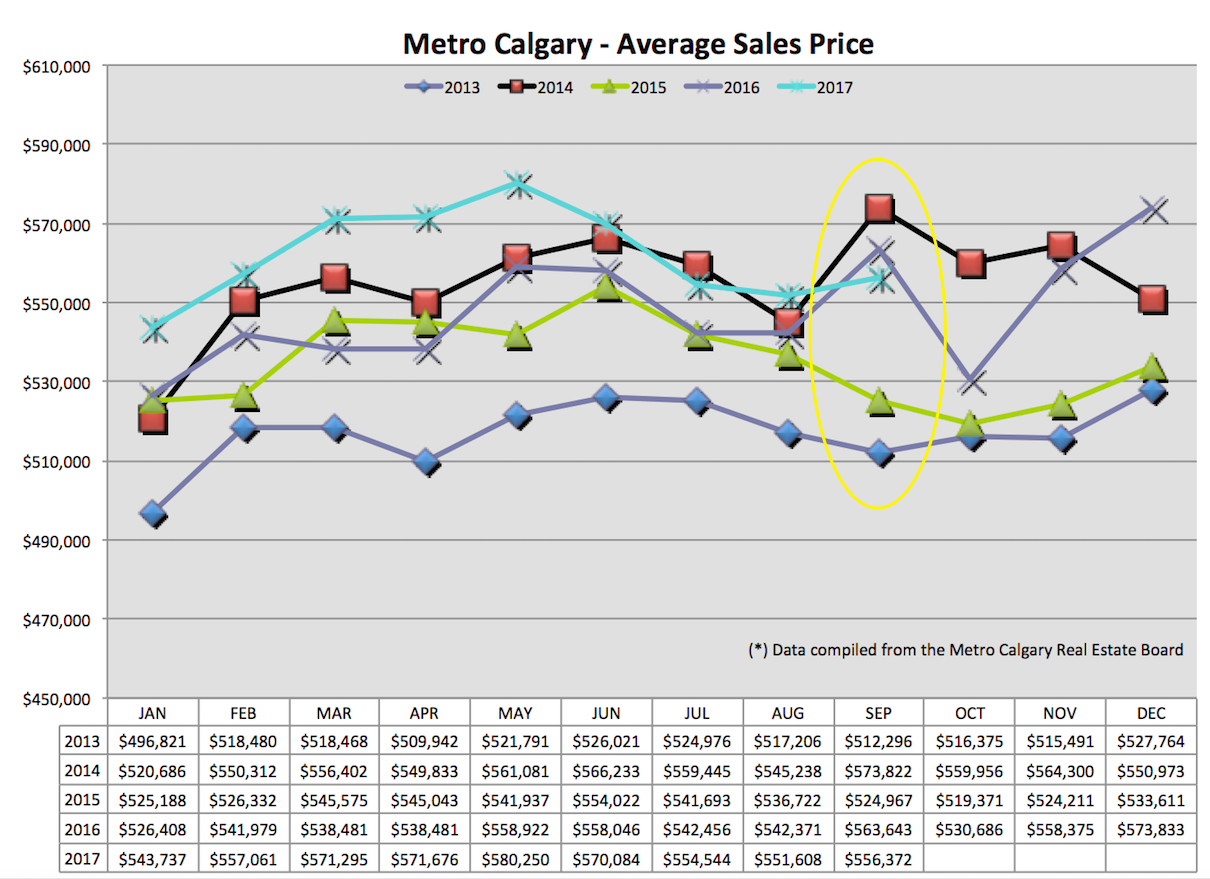
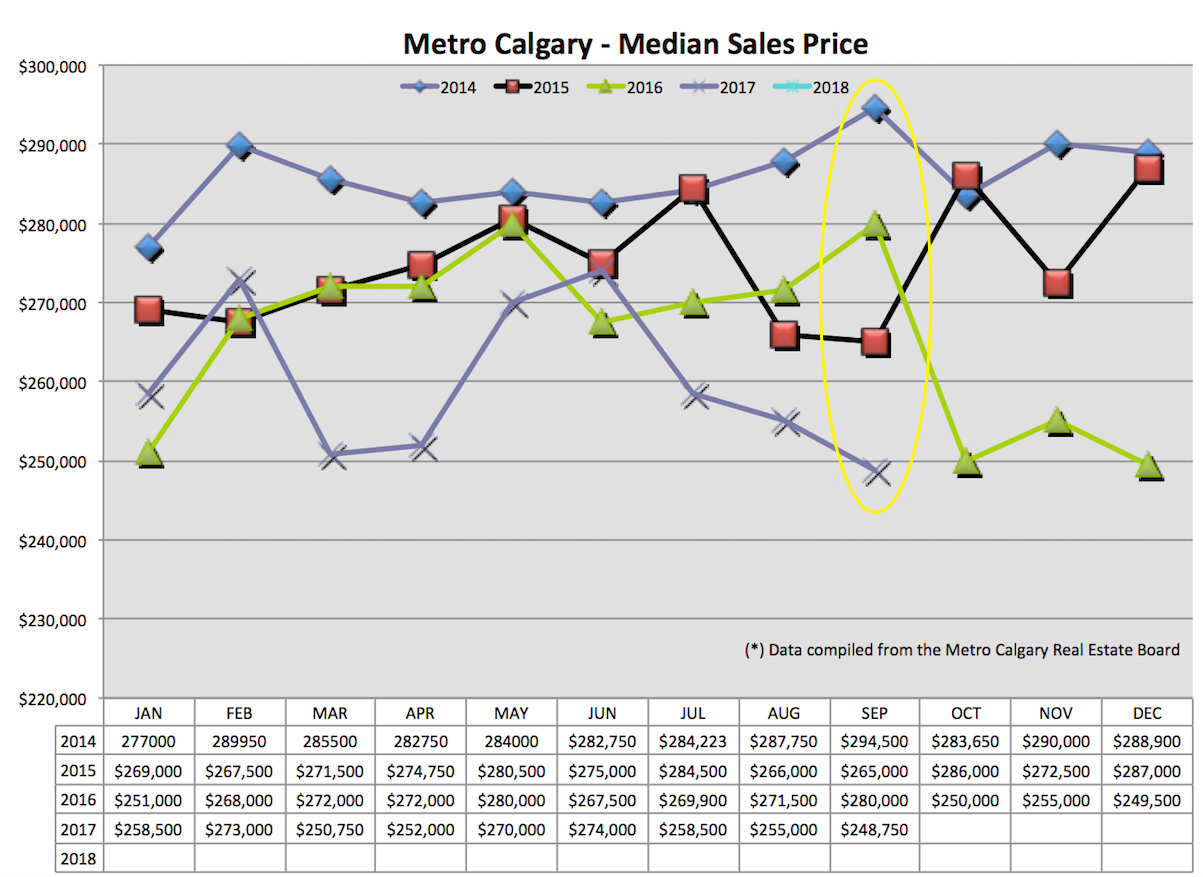
Average Sale Price:
This data point is found from averaging the total sales volume and dividing it by the number of sales. Remember, each quadrant of the City, area, neighborhood and price range has their own ebbs and flows of pricing. This is a high-level, general indicator of price trajectory. That said, average price is up month-over-month and down year-over-year.
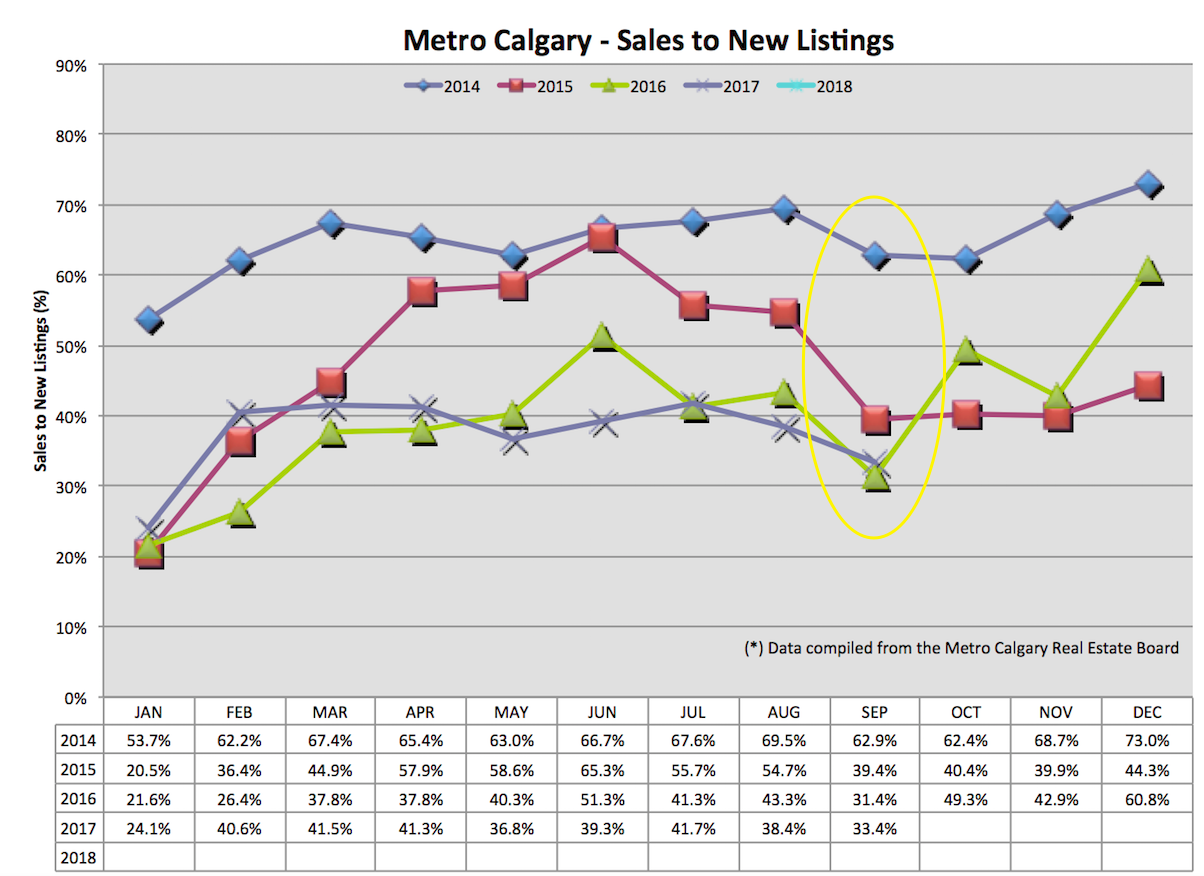
Apartment Data:
Sales To New Listings:
Good news! This data point is up year-over-year! Which might be a lonely bright spot in this month’s apartment data. This indicates to me there is more listing inventory coming onto the market for sale.
Absorption Rate:
Apartment absorption rate is 8.5 months. Meaning, it would take 8.5 months to sell all apartment listings inventory at the pace of September’s sales. This is quite high now.
Side Note:
I’ve been helping people convert their current condo’s into rental properties with the idea (hope?) of waiting to list them for sale again, in the future, in a different market (for more money?). Contact me for more details.
Median Price:
Clearly there is down pressure on apartment pricing. Data isn’t emotional. Until there is some relief in condo listing inventory or a significant increase in demand, expect there to be continued down pressure on pricing.
Conclusion:
Breath. The housing market is going to be OK.
With all of this said, what is the opportunity here?? Perhaps it’s a buying opportunity in a down market? What about an opportunity to renovate my current home instead of moving? What about an opportunity to minimize things in my home to make more room? Maybe I save the cost of selling/buying and invest those dollars instead??
Or maybe it’s a good time to meet with Chad and see what I can afford to purchase??
Schedule your initial phone appointment with me today.
Talk soon,
Chad Moore
P.S
If you find this data helpful for you let me know by clicking the “Like” at the top.