Stats Update: The Data Doesn’t Lie (or spin)
You’ll want to pay very close attention
to the Fall market we are heading into IF:
- You are thinking about purchasing a home in 6-12 months.
- You are pre-approved for a home purchase already and “waiting to see”.
- You’re waiting for the market to “bottom out” before buying.
I think there is going to be tremendous opportunity to purchase a home at a great price so you can build equity and long term wealth.
I track three housing statistics to help you anticipate where prices may trend in the near future. Obviously, the LARGEST leading indicator, influencing Calgary’s Real Estate market is the price of oil.
Remain connected to my email list and this blog to learn about Real Estate and relevant market updates.
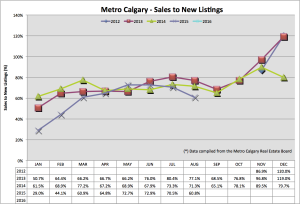
Sales To New Listings Ratio:
This statistic tracks the number of new listings entering the market, as a percentage net of home sales. Basically we can see how many new listings come into the market after removing sales.
If this number continues to sink lower and lower, we can forecast greater and greater supply. Here’s what this means …Calgary is already facing decreased demand. A combination of increasing supply further creates downward pressure on pricing.
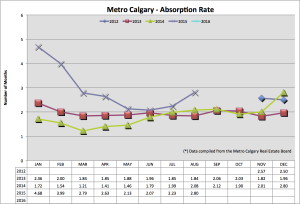
Absorption Rate:
The absorption rate tells us, in months, how long it would take to sell ALL of Calgary’s inventory at the current pace of sales. A balanced market is between 2-4 months. The higher the absorption rate, the more of a buyers market it is. A buyers market basically equates to more selection, downward pressure on pricing and the opportunity to buy at a lower price.
We can see the absorption rate increasing year over year AND month over month. This leads us to believe we have more housing supply coming into the market AND our pace of sales are slowing.
Average Price:
Year over year and month over month, we are down. You can also see a seasonal trend closely matching last year. I think, based on what is happening in Calgary’s employment sector, market sentiment and the two previous statistics, the closely matching trend will diverge in September. Time will tell.
Anticipating Interest Rates:
If you’ve spent any time reading my blog posts, from my email list or from Facebook, you’ll be learning first choosing WHO you do business with is the first domino to fall. Getting into the product, feature and benefits (interest rate) is next.
Below is an image showing us the spread in bond yields and Mortgage rates. When the blue line increases, the spread is growing IE: increased profits. In this scenario, we are in an environment of decreasing interest rates.
When the blue line, the spread, is quite low or narrow IE: low profits, we are in an environment of increasing interest rates (to increase the spread and profit).
Based on what I am seeing, there is no indicator of increasing interest rates any time soon.
Here’s What To Do Next:
If you are working, have savings for a down payment and have established credit – contact me today!
Here’s why:
- Understand your affordability so you can gain context of specific “markets within the market” in different areas of the city in today’s market.
- Save time by narrowing down your home search. Stop wondering if you can afford that home.
- Save money by arranging the best Mortgage Strategy, interest rate and customized product specifically for you.
- Understand your credit and how to improve it (if needed) so you can purchase a home worry free.
- Work with a professional and customized team of Real Estate professionals motivated by customer service.
Contact me at 403-809-544 or chad@canadamortgagedirect.com
Talk soon,
Chad Moore
P.S
I put a great deal of effort into this content for you and would like your feedback. If you like this post, please let me know by sharing it with your network and clicking the “Like” button at the top.
If you would like to access my email list, please do so here.
Recent Posts
Calgary Market Update—March 2025 Data
Here are some Calgary Real Estate numbers, across all property types, out of the gate for…
Interest Rates Up Or Down?
Hey Guys! Tariffs are here. Now what? Tiff Macklem, governor of the Bank of Canada, gave…
Bank of Canada Hot Mic Moment
Hey Guys! The Bank of Canada publishes "meeting deliberation notes" relating to the discussion of raising,…
Banker’s Damaging Admission
When the governor of the Bank of Canada speaks, we listen! Tiff Macklem, governor at…
January 2025 Market Stats
Let's look back at January 2025 Calgary Real Estate Board (CREB) data to make sense…
Mortgage Interest Rate Review
Hey Guys! Here's an example of how the Bank of Canada is in a balance…


