Hey everyone!
In this blog post I break down three statistics to help you anticipate future listing inventory in Calgary’s Real Estate market. This helps you make better sense of supply and demand economics, which influence home prices.
I do all of this cut through media hype and help you understand the supply side of our Real Estate market. Ultimately, I want to earn your trust, future business and referrals.
However, I do not like to “sell” any of my clients. I like to help educate you on why I am the best option to place your Mortgage today, and manage it with you over the years to come.
Be sure to ask me about “how to shop for a Mortgage” and my BOSS Mortgage Strategy!
Please continue reading this content and share on Facebook if you like it! Call or email to discuss your personal Mortgage situation, if you have any questions or concerns.
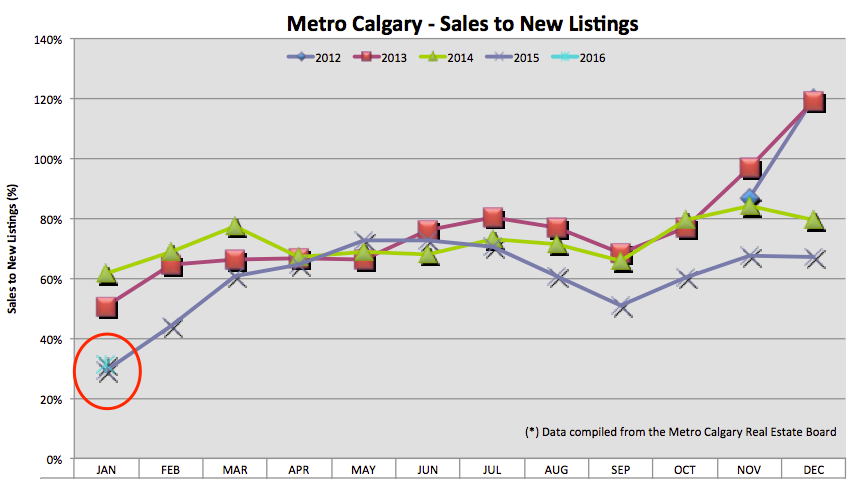
This ratio helps us understand how many new listings are entering the market versus how many homes are sold. A lower ratio indicates MORE listings being added than home being sold. Today, our ratio indicates more listing inventory hitting the market. This is good news for you buyers out there! More selection AND down pressure on pricing.
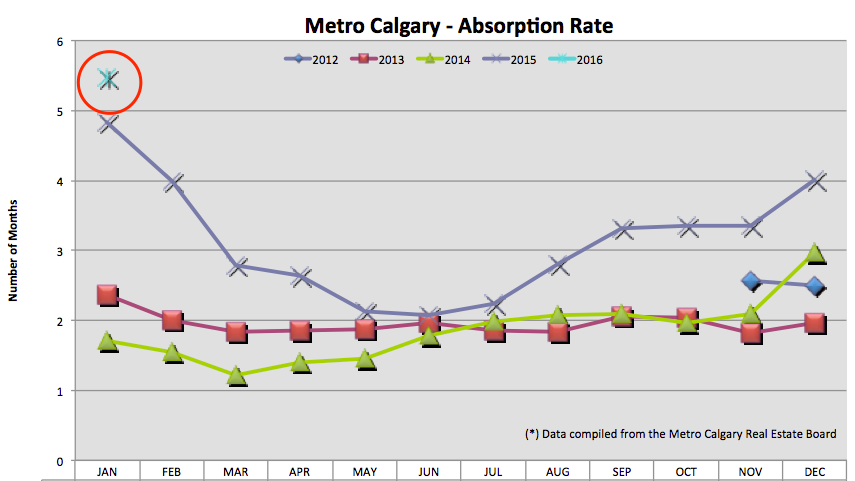
The absorption rate tells us in months how long it would take to liquidate (sell) ALL detached single family homes in Calgary, at the pace of that months sales. A high monthly output indicates more inventory and or slower sales volume. Year over year, the listing inventory is about the same BUT the monthly sales volume is down, giving us a high absorption ratio. Again, if you’re a buyer this is GREAT news. There is less competition, more listing selection and down pressure on pricing.
Take the total sales amount of single detached homes sold and divide it by the number of homes sold to find the average. This indicates seasonal, monthly and annual trends for context.
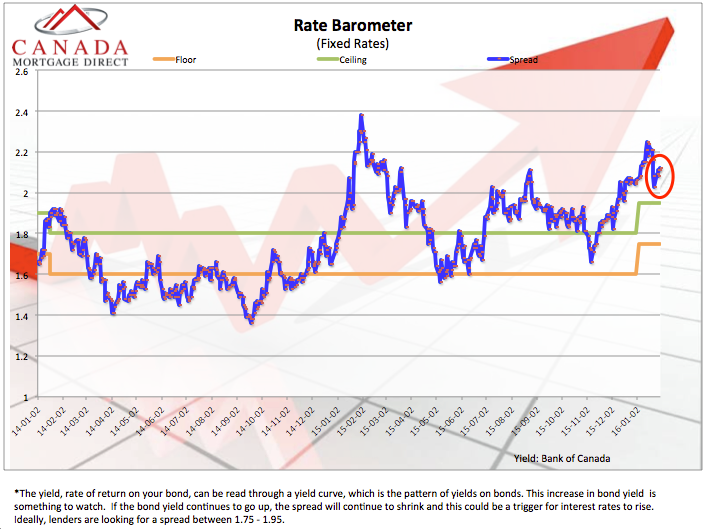
The blue line below indicates the spread in the Canadian Bond market. The spread in the Bond market is a short term indicator of fixed interest rates. A rising/high spread indicates down pressure on fixed interest rates, which is what we see today. However, our Government increased the cost of borrowing for Banks in Canada. This added cost is being passed onto the consumer in the form of higher interest rates (or in our case, rates that should be lower but are not).
Thank you for making time to read and share this blog post. If you are planning to purchase a home this Spring or Fall add me to your list of contacts to reach out to.
If you like this content, please let me know by sharing it with your network.
Thank you,
Chad Moore
Here are some Calgary Real Estate numbers, across all property types, out of the gate for…
Hey Guys! Tariffs are here. Now what? Tiff Macklem, governor of the Bank of Canada, gave…
Hey Guys! The Bank of Canada publishes "meeting deliberation notes" relating to the discussion of raising,…
When the governor of the Bank of Canada speaks, we listen! Tiff Macklem, governor at…
Let's look back at January 2025 Calgary Real Estate Board (CREB) data to make sense…
Hey Guys! Here's an example of how the Bank of Canada is in a balance…