When looking at the data below, I subtly nodded my head with a slight smile of approval. I think Calgary’s Real Estate data is about where my regular readers would think it might be.
Why?
I think the Mortgage rule change pulled some demand forward in the lower price ranges. These would be first time home buyers getting onto the property ladder before qualifying for a Mortgage becomes more strenuous.
Let’s take a look at three market statistics that help us make sense of near term Real Estate price movements.
When layering these data points on top of one another, I get a sense of what the near term future holds in the general direction of price movements.
I think this provides a context of “what’s happening” in Calgary’s Real Estate market, based on data. Here’s why …Real Estate pricing is heavily influenced by supply and demand. Really, these data points consider the supply side of this equation. Visit my blog, like my Facebook page, comment below, or email me directly to also be updated on the demand side of Real Estate.
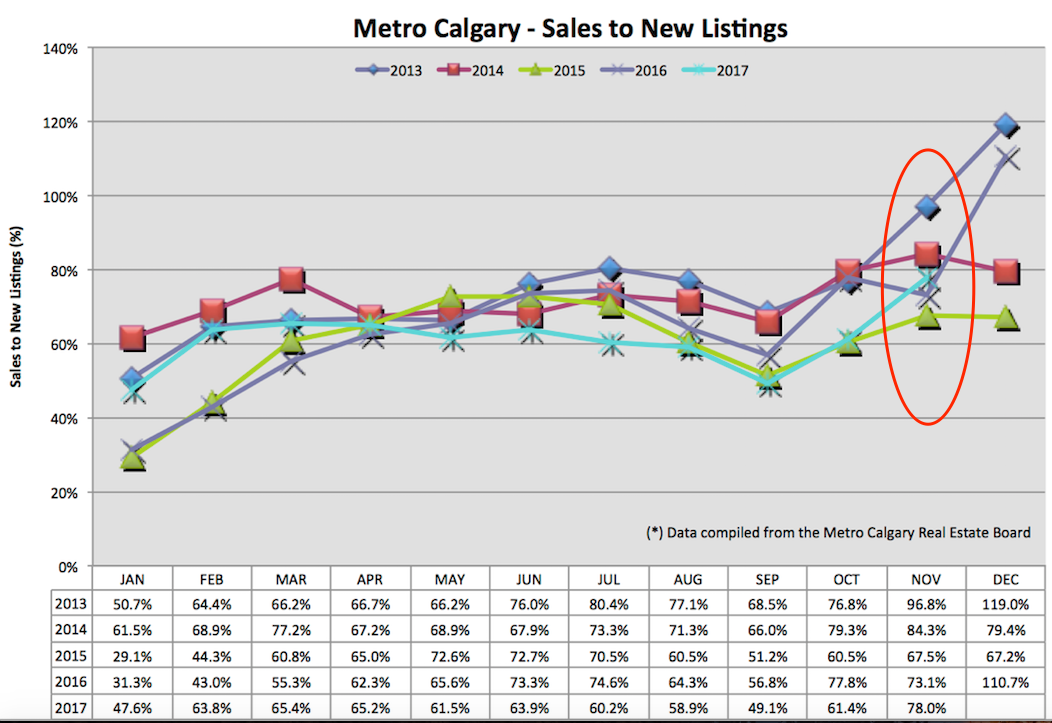
This ratio compares new homes coming on to the market (new listings) with homes leaving the market (sold or expired listings). An upward trend indicates less future inventory which helps support pricing (or is an indicator for increased pricing).
I think the Mortgage rule changes brought forth some additional demand. Some home buyer’s mindset is to make sure they could get onto the property ladder, at a price range they preferred.
You’ll note last year the sales to new listings ratio jumped last December which was a leading indicator of a very busy Spring market (which happened). Why? Because this is a leading indicator of less supply. With demand being equal, if not gaining momentum, there is upward pressure on prices (or at least a more urgent sense for buyers to let go of the “wait and see”mindset).
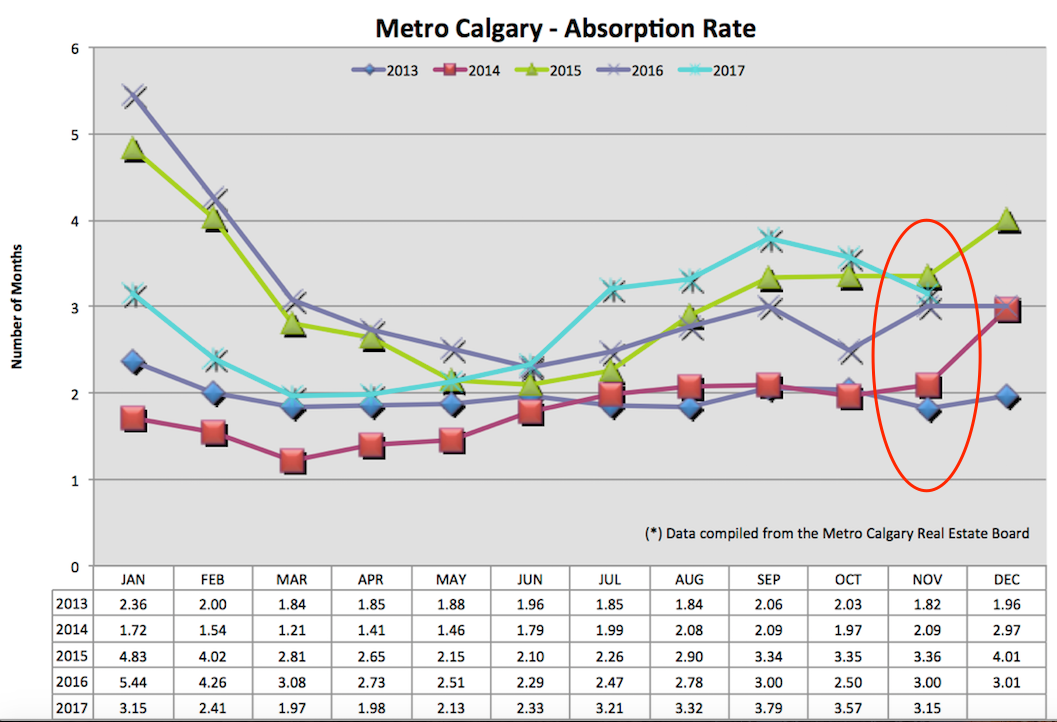
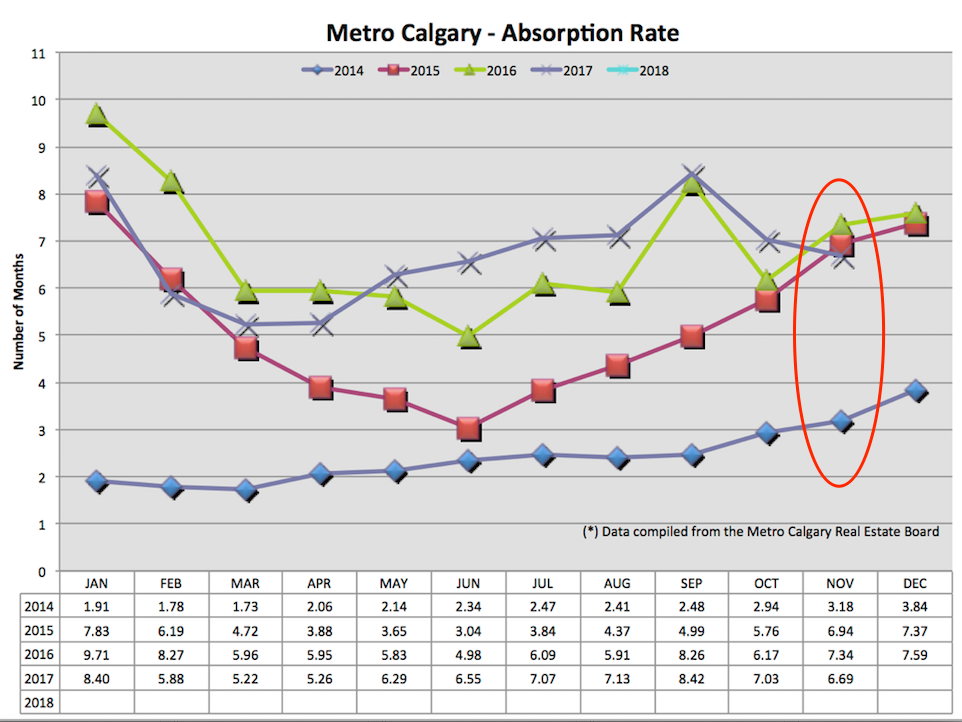
This ratio combines home sales and inventory to provide a data point of interest. The absorption rate tells us, in months, how long it would take to liquidate all detached listing inventory, at the pace of that month’s sales. The lower the absorption rate, the less inventory and or more home sales there are. Low trend lines indicate a seller’s market. High or upward trending numbers indicate a buyers market.
Calgary’s detached absorption rate is trending down. This speaks to an increase in the number of home sales year-over-year relative to a simultaneous increase in detached home inventory year-over-year. This trend speaks to stabilized pricing.
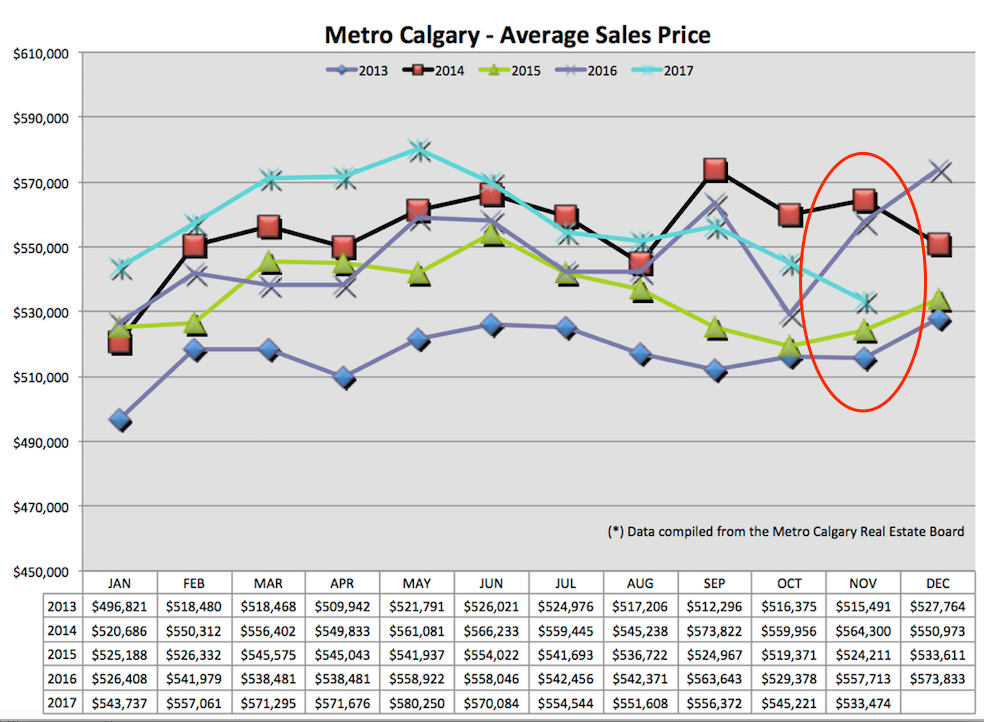
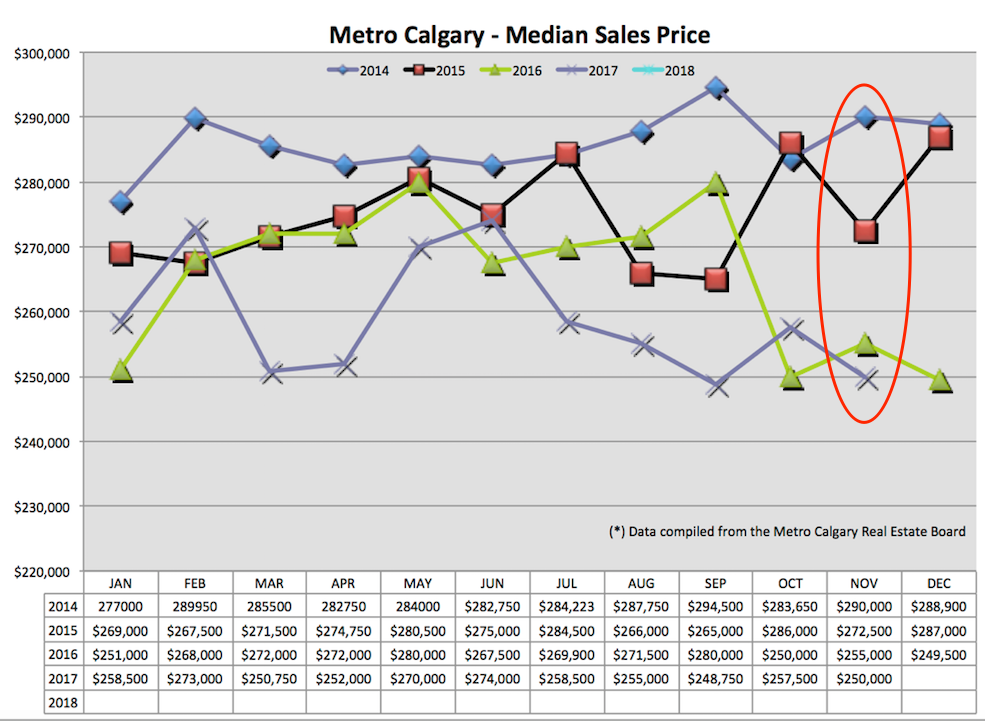
Average price is trending down for the third straight month. According to the CREB data, the largest housing gains were in the $300-$399K price range which would drag on the average price. Similarly, other moths of data can be skewed higher due to activity at higher price ranges.
Each quadrant, area, neighbourhood and street is a micro-housing market on it’s own. Connect with me to be referred a top quality person, who is also a Realtor.
We’re seeing an increasing trend line, that is in alignment with month over month and year over year data. This is positive news for condo sellers, many of whom have/are feeling the brunt of a challenging sales environment. That said, this is an opportunity for buyers to consider a long-term value purchase.
Seasonally this number is trending in a different direction than last year, which bodes well for future pricing stability (or at least trending in that direction). With the context of previous markets, one can see the challenge the apartment market is still facing. I think buyers can seek value, have options and definitely have the upper hand in negotiations.
Again, median price shows a very different data set today versus several years ago. I find this valuable for context. This also shows how volatile this section of the housing market can be. I see continued pressure on the Calgary apartment market pricing. Buyer’s, this might be a great entry point looking back. Seller’s, consider strongly pricing your home in the market.
Thanks for reading! Please let me know you like this data by clicking the Facebook like button at the top of the post.
Talk soon,
Chad Moore
Here are some Calgary Real Estate numbers, across all property types, out of the gate for…
Hey Guys! Tariffs are here. Now what? Tiff Macklem, governor of the Bank of Canada, gave…
Hey Guys! The Bank of Canada publishes "meeting deliberation notes" relating to the discussion of raising,…
When the governor of the Bank of Canada speaks, we listen! Tiff Macklem, governor at…
Let's look back at January 2025 Calgary Real Estate Board (CREB) data to make sense…
Hey Guys! Here's an example of how the Bank of Canada is in a balance…