Hey Guys!
I have more charts for you, AND these charts now go back 10 years worth of data.
I think this provides more context to Calgary Real Estate data, and is something you might find more interesting!
Let’s look Calgary Real Estate Board (CREB) detached and apartment home data. We key in on several metrics that help anticipate near term movements to supply.
I also write additional content relating to Real Estate demand. Why? Supply and demand are forces that collide to create price discovery.
Detached Homes:
Sales To New Listings Ratio:
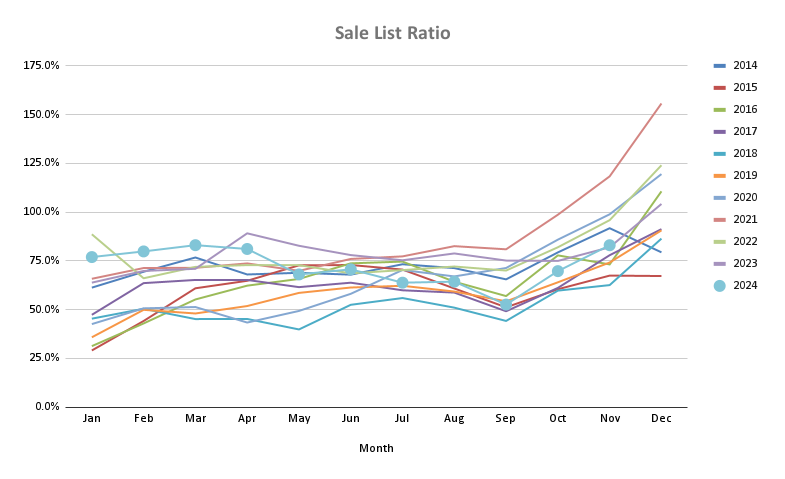
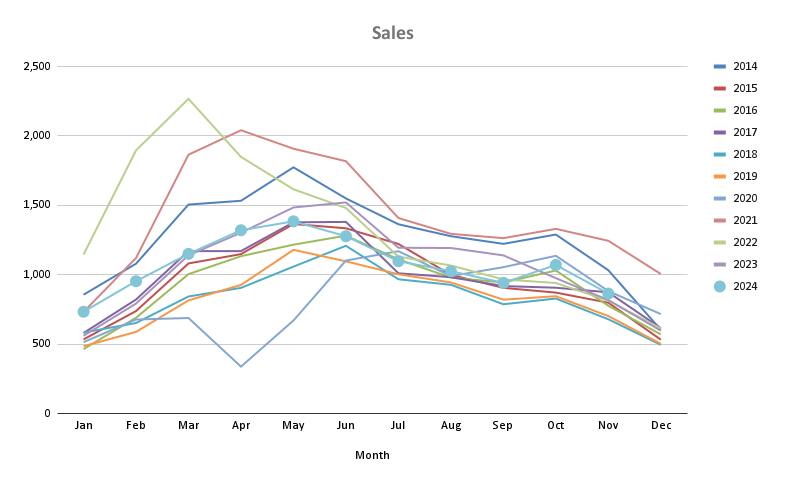
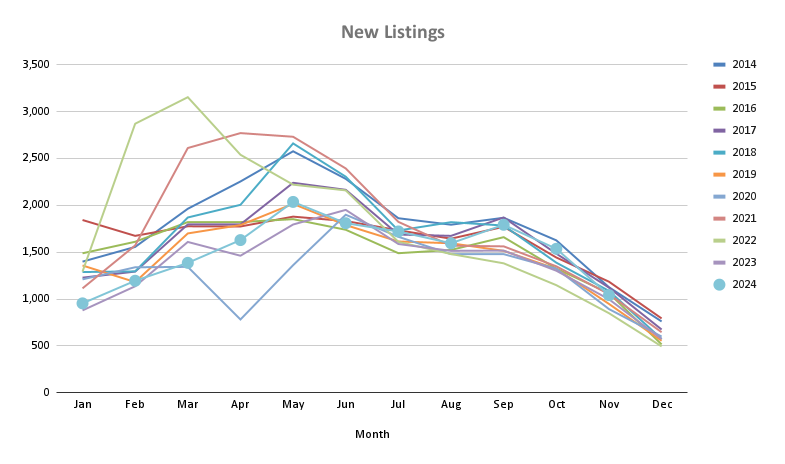
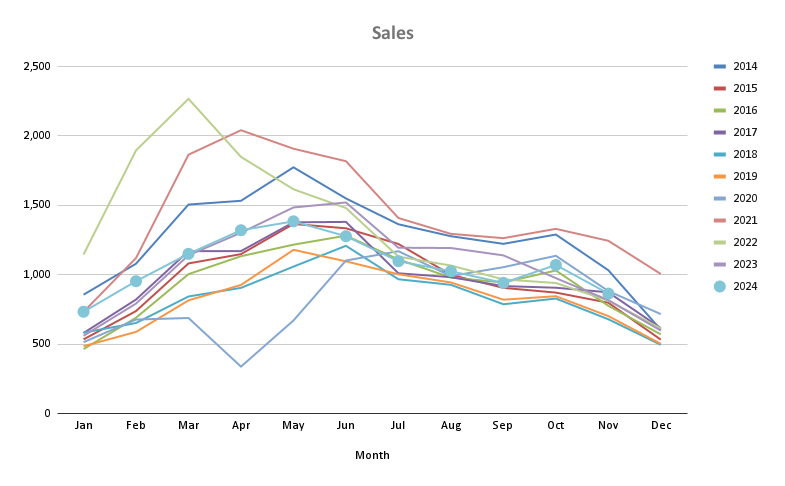
The first chart below is what you’re use to seeing, “sales to new listing ratio.” I’ve added a chart of sales data (homes sold), and a chart for new listings.
This is so you can see the month over month, year over year movement of numbers—relative to the past 10 years.
For all three of these charts, the numbers are landing close to the middle of the past 10 years of data.
Detached home sales are higher than Calgary’s recessionary period, and lower than the most recent housing boom period.
The same is said with new listings being added to the market. We are seeing a seasonal decline of new listings, about in the middle of the previous 10 years of data.
The sales to new listings ratio is above 75% which is pretty much in the middle of the past 10 years worth of data. There is inventory building up, but not an an extreme level.
Absorption Rate:
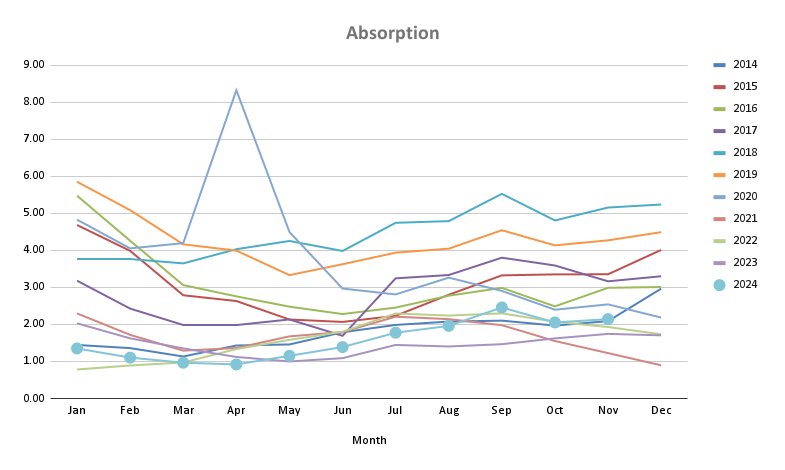
The absorption ratio chart is what you’re use to seeing. Calgary’s detached absorption rate is at 2 months—which is on the lower bound of the previous 10 years of data.
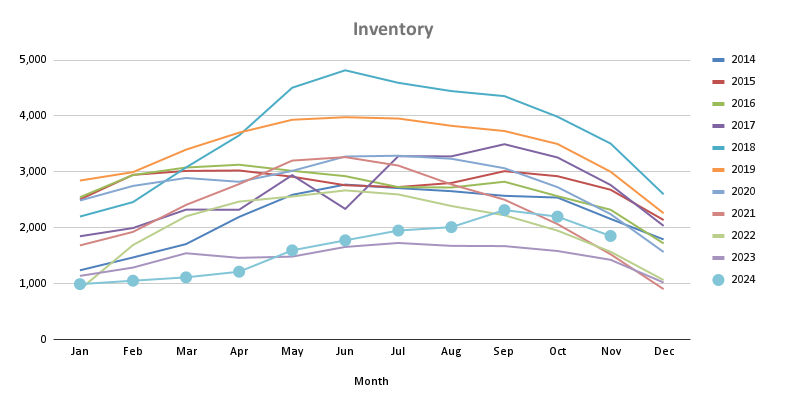
I’ve added the chart of Calgary detached home sales, again. The third chart below is total detached inventory—and this is what’s causing the lower absorption rate.
Calgary detached inventory is on the lower end of data for the past 10 years. This past year in particular, had the lowest inventory numbers. Only recently in August and September has inventory risen to higher levels than some previous years.
If we start the 2025 spring market with low inventory, this would bring back home purchase competition. The question is, to what level will home buyers compete when they write offers?
Average Price:
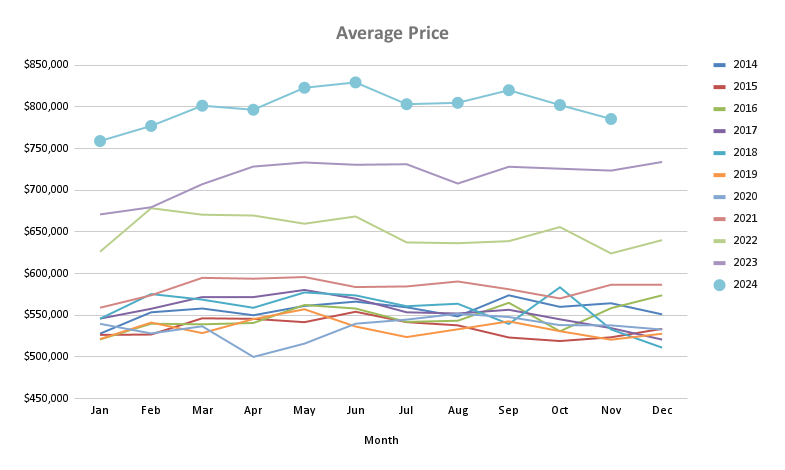
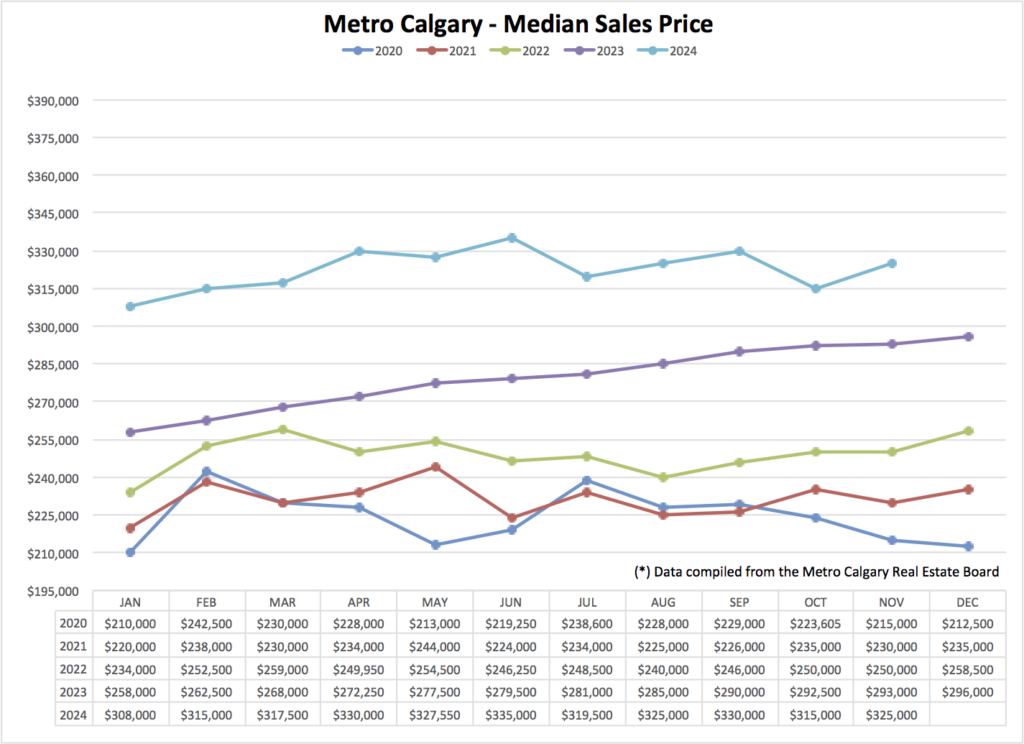
We can see Calgary detached average home values leap-and-bound higher over the past three years.
The most recent two months have started a trend lower, for now. Anecdotally, I’m experiencing more sales come in below list price. However, I’m also hearing some homes are seeing competing offers.
I think a good Realtor will help you navigate these tricky waters.
Apartment Homes:
Sales To New Listings Ratio:

Absorption Rate:
For two months now, Calgary’s apartment sales to new listings ratio has risen. This will help slow down apartment inventory growth.
Seasonally, the sales to new listing number rises into the last several months of the year—and this year is not different.
Note the sizable drop of this ratio year-over-year though. Since April 2024, there has been a divergence in new apartment listings.
Median Price:
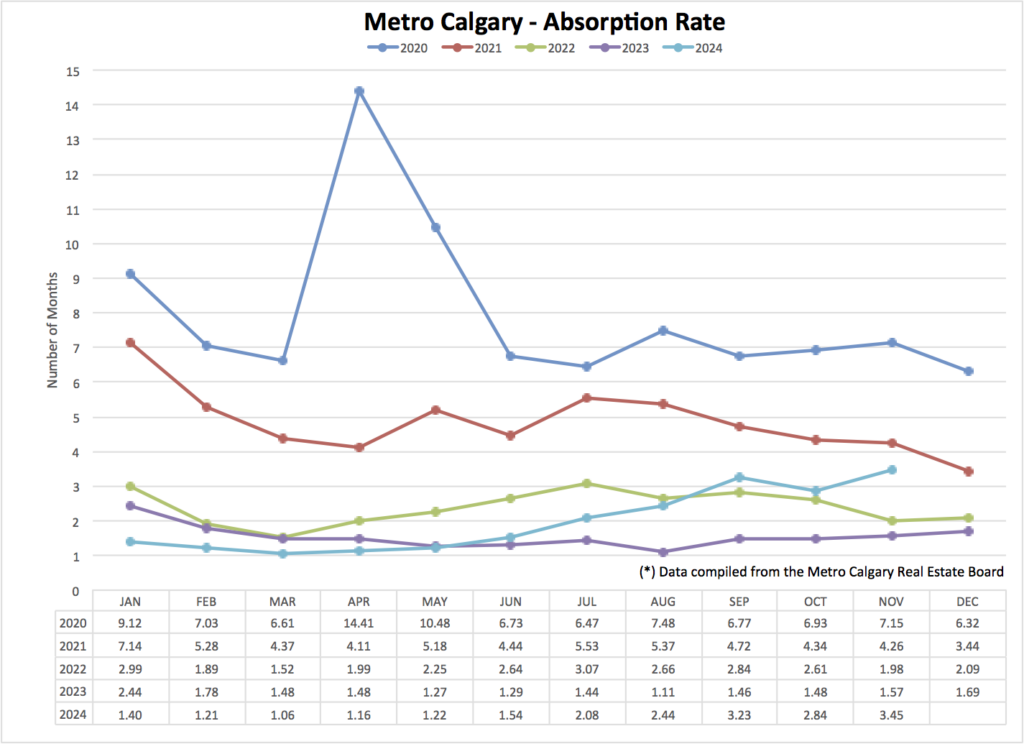
Calgary apartment absorption rate is in balanced territory (balance means between 2-4 months of inventory).
Apartment absorption rate has been increasing from the low’s of May, earlier this year. There is still a trend to higher absorption, but at a slower pace. With the apartment sales to new listings ratio increasing, that will help push back on growing inventory levels.
Again, there is a noticeable increase of absorption year-over-year. This looks to be a leading indicator of a much more balanced apartment market in 2025.
Bonus New Build Charts:
I’ve mentioned before that I am a paid subscriber to Ben Rabidoux’s newsletter—Edge Analytics (if you’re in the industry, I recommend subscribing).
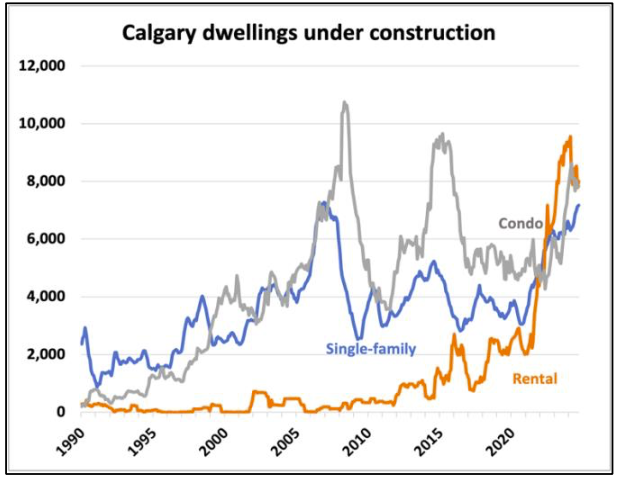
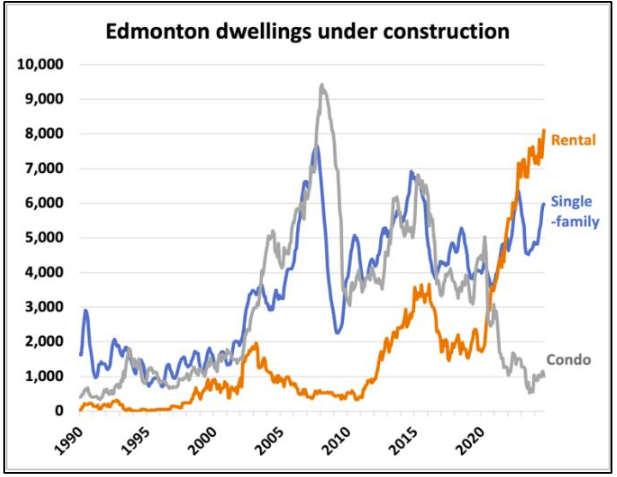
Here are two charts of Calgary and Edmonton “dwellings under construction.”
Note the recent condo building difference.
There is no land shortage in Alberta!!
Bank of Canada Rate Cut Preview:
The next Bank of Canada interest rate announcement is December 11th.
The market is all but guaranteeing a 0.25% rate cut. And I’m seeing about 50% odds of a 0.50% rate cut.
Today, the current Bank of Canada rate is: 3.75%
Today, the commercial bank Prime rate is: 5.95%
For every $100,000 of Mortgage you have, a reduction of 0.25% will lower your Mortgage payment by about $12/mo.
Here’s what is important to note …fixed and variable rates are not a direct function of each other. Fixed and variable interest rates do not always move in the same direction.
Since the Bank of Canada began the rate cutting cycle in June, fixed interest rates went lower, but more recently there has been upward pressure on fixed interest rates.
Fixed interest rates move up and down based on government of Canada bond yields. Many factors influence the price of Canadian bonds like a) inflation, b) U.S Treasury prices, c) the Canadian dollar, and d) oil.
Conclusion:
This time of year starts to set up next years’ spring market.
The absorption rate for detached and apartment homes is finally off the rock-bottom-basement-floor. The absorption rate for both is rising year over year, and slightly month over month.
New listing inventory is building, but not at a pace that indicates a significant change of overall inventory in several months time. This helps keep a lid on overall inventory.
The “interest rates are falling” narrative has found it’s way into the general psyche of home sellers and buyers. However, when buyers find out that fixed interest rates still start with a “4” and variable rates start with a “5” they are surprised.
Remember, fixed and variable rates move based on different market functions. The Bank of Canada moves variable rates, and bond yields move fixed rates.
To me, this looks like another busy spring market is shaping up for the detached market—with demand outstripping supply, again. Let’s wait and see to what extend, and how aggressive buyers become with their offers.
The apartment market is looking to be much more balanced, with noticeable differences in sales-to-new-listings and absorption ratios.
I hope this is helpful. I also hope you liked the additional context of detached housing stats/graphs.
Thank you for reading!
Chad Moore

