Hey Everyone!
Below is another Calgary Real Estate market summary. I create this content so you have a simple statistical summary of important data to anticipate near term market movements.
I find this helpful in understanding potential price movements, especially if I am considering entering the housing market. Please do understand, this is a relatively high level over all analysis of Calgary Real Estate. Each price band and quadrant you’re interested in moves in-and-of-itself. Connect with me to speak with a full time professional Realtor for additional advice.
That said, I hope you do find this valuable in your Calgary Real Estate market interpretation. Let’s go!
Below are three statistics to help you understand today’s market and anticipate near term price movements (up or down).
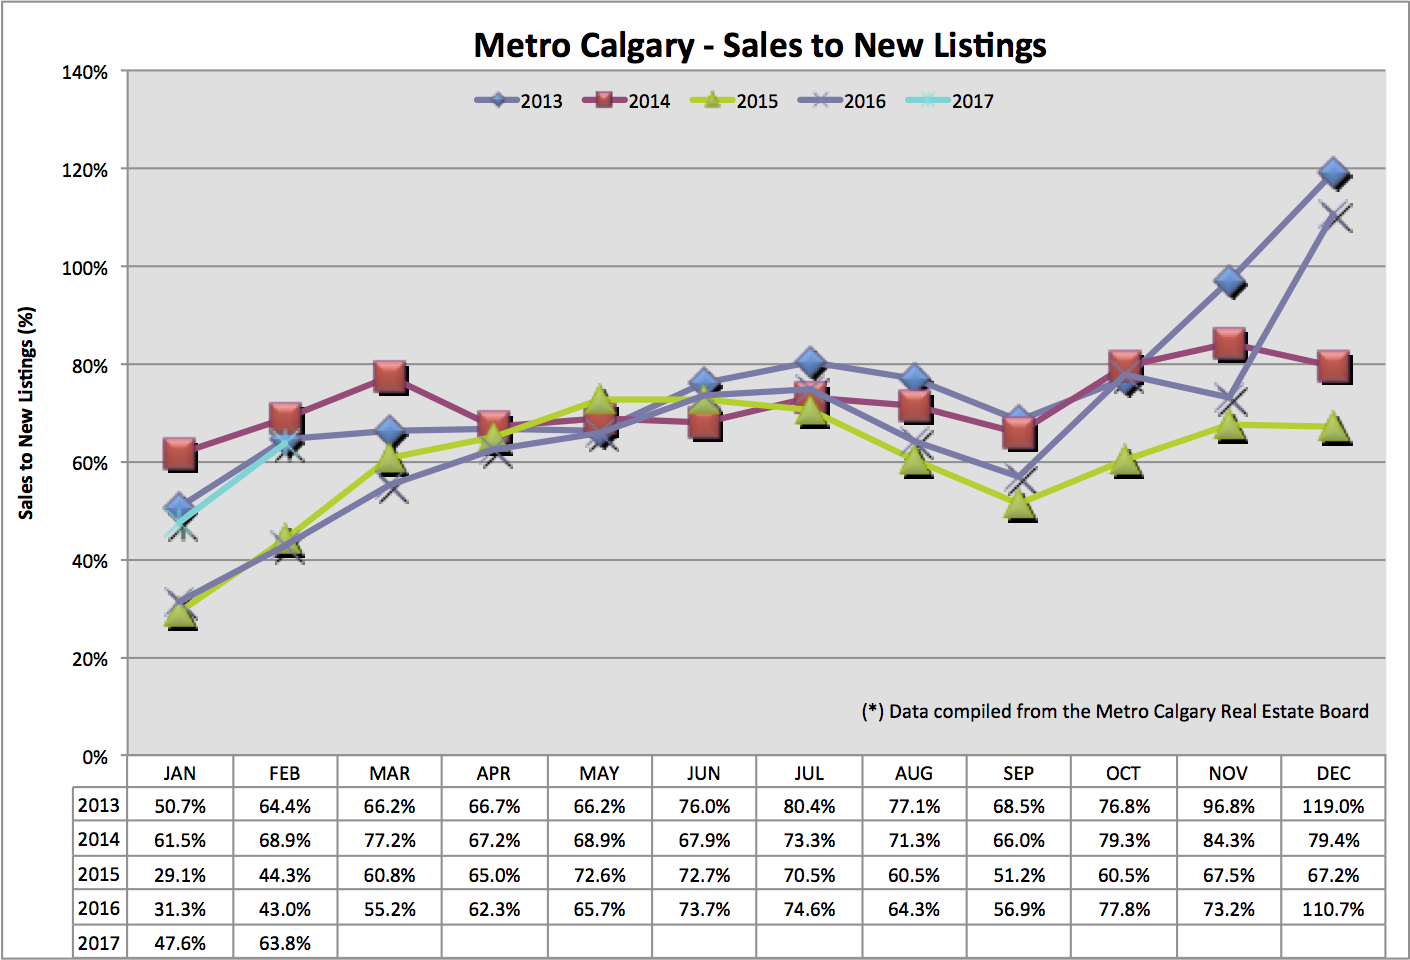
This ratio looks at homes leaving the market compared with homes entering the market. Said another way, homes sold compared with new home listings. For context, an increasing ratio is interpreted as less future supply of homes for sale. A decreasing ratio means there is more home inventory expected to be for sale.
We are basically anticipating the SUPPLY side of the supply/demand relationship in Real Estate pricing. Less supply equals supportive or upward pressure on pricing. More supply equals downward pressure on pricing.
In February 2017, we’re seeing month over month sales to new listings data increase. Year over year, we’re beginning a similar seasonal trend line much better than the previous two years. I anticipate continued upward pressure on Calgary detached pricing in the near term future. I think it is possible the worst is behind us in this type of housing.
This is another statistic that looks at near term future supply of home listing inventory. The absorption rate looks at total monthly listing inventory compared with the total monthly number of sales. The output tells us, how long it would take in months, to liquidate ALL the inventory at the pace of that months sales rate. For context, between 2-4 months is a “balanced” market. Lower absorption rates indicate higher sales volume matched with lower inventory levels.
You see below the first two months of 2017 month over monty and year over year are significantly lower than the previous two years. We’re following a very similar seasonal trend line. All signs are pointed to supported or increasing prices in Calgary’s detached single family market.
The average price gives us context of month over month and year over year price movements. Please understand the average price can be skewed by large monthly sales volume at the top or lower end of homes sold.
With the context of sales to new listings ratio and absorption rate data above, for the past three months (or so), the resulting average price increase is expected. I see this seasonal trend continuing … UNLESS there is a flood of new inventory as higher home price information gains more media attention and home owners look to sell.
We are following a very similar trend month over month and year over year. This trend is moving in the direction of less listing inventory, which I think is very helpful to Calgary apartment pricing. Time will tell what the third quarter of 2017 looks like and if there is a similar trend at that time too.
Again, we are following a very similar trend line seasonally. The 2017 data points to lower numbers within this trend line though. This is a bright light for apartment pricing.
The median price is found by taking the middle number of total sales of Calgary apartments. This is an attempt to smooth out price volatility. With a smaller data set in Calgary apartments, I think price fluctuations make anticipating trend lines less obvious.
Again, we see seasonal trend lines year over year and month over month, with the data looking better than previous years.
Based on the above data, I think there are some bright spots to consider in Calgary’s Real Estate market. I think for many of those in the “wait and see” mindset, justifiably, for the past two years might consider revisiting their home affordability. This is IF they also feel confident in their future employment prospects.
One thought amongst some of my industry conversations is this …once the price support (upward trend) of detached single family homes filters through the media in to the main stream, listing inventory might increase.
Another “thing” to consider is the “demand” side of anticipating Real Estate. Continue to visit my blog – or join my email list – to learn about indicators and statistics of employment improving and or net migration numbers to (or from) Alberta/Calgary.
Thank you for reading! Please click the “Facebook Like” button above.
Talk soon,
Chad Moore
Here are some Calgary Real Estate numbers, across all property types, out of the gate for…
Hey Guys! Tariffs are here. Now what? Tiff Macklem, governor of the Bank of Canada, gave…
Hey Guys! The Bank of Canada publishes "meeting deliberation notes" relating to the discussion of raising,…
When the governor of the Bank of Canada speaks, we listen! Tiff Macklem, governor at…
Let's look back at January 2025 Calgary Real Estate Board (CREB) data to make sense…
Hey Guys! Here's an example of how the Bank of Canada is in a balance…