Here’s why you want to read this blog post:
- Help you anticipate the future of home prices in Calgary.
- Simple to understand numbers, without the media hype or spin.
- Context of month over month and year over year data for a clearer understanding.
- Anticipate fixed interest rate movements.
Let’s dig in …
Calgary Mortgage & Real Estate Data:
Sales to new listing ratio:
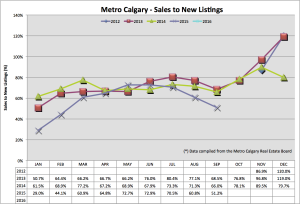
This ratio takes the number of sales divided by the number of new listings added to the market. The data we are looking at is displayed as a ratio.
A decreasing ratio indicates there are more new listings coming into the market than there are sales. This leads to increasing listing inventory over time.
Here’s why this is important: the laws of supply and demand are very real in Real Estate. Today we are seeing decreasing demand as a drag on our housing market. IF this combines with increasing housing supply, a case is made for accelerated downward pressure on home prices. That is what we can anticipate, based on this information.
Absorption rate:
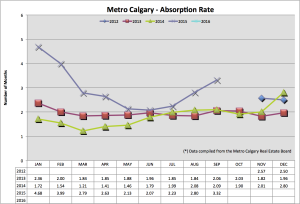
The absorption rate tell us, in months, how long it would take to sell ALL of Calgary’s inventory of single family detached homes, at the current pace of sales in September.
A balanced market is between 2-4 months. Higher absorption rate numbers indicate a buyers market, with more inventory to chose from.
The absorption rate is a leading indicator of home prices in Calgary based on anticipating supply. As you can see, our absorption rate is significantly increasing month over month and year over year.

Average sales price:
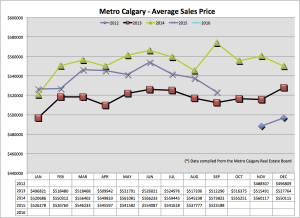
The average sales prices shows us month over month and year over year, price ebbs and flows. We can see here that September has proven to be a divergent month, breaking away from following a similar trend in 2014. Analyzing the data for September 2015, I think October 2015 will continue the divergent trend from 2014.
Fixed interest rate barometer:
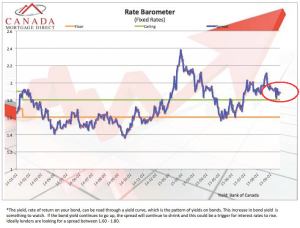
Fixed interest rates are determined from the Canadian bond market. Mortgage lenders make a “spread” on the money they lend, which is indicated below by the blue line.
As you can see, from the blue line, the spread Mortgage lenders are making is quite high. This leads me to believe fixed interest rates are NOT experiencing pressure to increase.
Bank of Canada (BoC):
The BoC has another opportunity to change the Key lending rate in Canada. The Key lending rate effects the Prime lending rate of Banks. The Prime lending rate effects Bank loans, lines of credit, and any adjustable/variable rate Mortgages.
A major leading indicator of the BoC increasing the Key lending rate is inflation. With China’s economy weakening, and goods from China decreasing in value, I do not see our cost of living increasing to increase inflation. This is also on top of cheaper commodity prices as well.
Share if you care:
Thank you for reading this information!
If you’re thinking about purchasing a home in the next 6-12 months, consider how important it is for you to plan everything out. Your next Real Estate purchase is incredibly important to you and involves A LOT of money.
Make time today to speak with me about how much you can afford, understanding your credit score and much more. All of my service is 100% risk free and no obligation. I want you to have the best experience with the best Calgary Mortgage Broker!
Please let me know you appreciate this information by sharing it on your social networks or commenting below.
Thank you!
Chad Moore


