Is This Winters Real Estate Data Thawing The Calgary Market??
Calgary Detached Housing Market
I’m tracking three statistics to help YOU understand what might happen in the near term future of Calgary Real Estate pricing. I think this data really puts a nice frame around month-over-month and year-over-year data to make sense, with context, of what’s happening today.
The three stats below are sales to new listings ratio, absorption rate, and average price.
Please consider sharing this information on Facebook with those who are considering entering the Real Estate market OR simply emailing this link to them.
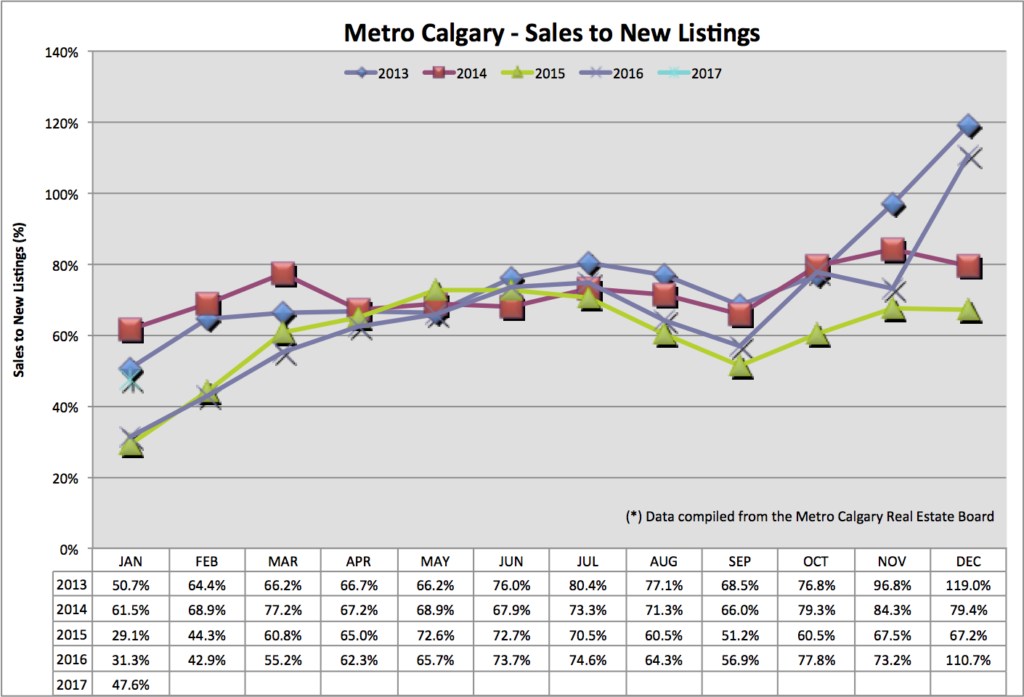
Sales To New Listings Ratio:
This data point connects the amount of NEW LISTINGS entering the market with HOME SALES (homes leaving the market). A decreasing ratio indicates more and more homes are being ADDED to the market, net of sales. An increasing number tells us there are less homes for sale in the market.
Understanding the relationship of supply and demand, related to home pricing, is helpful to anticipate movements up or down. This ratio helps us anticipate near term housing supply levels. Anticipating demand levels come from statistics such as: net migration to Calgary, unemployment rate and local industry health (Oil).
We’re seeing an increase of 16.3% year over year of this ratio (good news for future pricing). Seasonally, we can expect to see this ratio increase throughout the busier Spring market.
Absorption Rate:
The absorption rate compares total listing inventory with monthly home sales volume. Absorption tells us, in months, how long it would take to sell ALL the listing inventory of homes for sale, at the pace of that months sales.
For context, a balanced market is between 2-4 months. A lower the absorption rate indicates a “hot” or “sellers” market (as you see in 2013 – 2014). Higher absorption rates indicate a “slow” or “buyers” market.
January 2017’s absorption rate is WAY down year-over-year and month-over-month. Each input of data is better than January 2016 (really, not that difficult :-)). Sales volume is up and total listing inventory is down. I think this bodes well for upward or consistent home pricing in Calgary.
Average Price:
Average price is found by totaling all home sale volume divided by the number of homes sold. As with any average, data can be skewed by large or small numbers at either end of the spectrum.
Looking back at previous Sales To New Listing and Absorption Rate data points, anticipating an increasing average Price seems intuitive. I expect more upward or sustained Average pricing in the near future.
Calgary Apartment Market
Sales To New Listing Ratio:
January 2017 data is about the same as the previous two years. Using previous years information, I think anticipating a similar trend in the coming months is reasonable.
Absorption Rate:
Calgary’s apartment absorption rate is down year over year (good). We are still higher than 2015 (indicated in red).
When looking at this graph you can notice the large difference between absorption rates from 2014-2017. I think, during profitable Real Estate times, condo builders began many projects that are now flooding the market with supply. This is driving up listing inventory, in turn driving up absorption rate numbers we have today. With the lag time in building large condo projects, timing the market proves difficult.
Median Price:
Median price takes the middle number of apartment sales in Calgary.
With a lower volume of apartment data to create information from, I think this helps smooth volatility (although this graph proves more difficult to assess trend lines).
Interest Rate Barometer:
Fixed interest rates are derived from the Bank of Canada five year bond. Whether we like it or not, Canada is tied to the U.S in many ways. Recently the U.S Treasury Bonds have been increasing, dragging Canada Bond market higher as well. This upward pressure shrinks Mortgage lender margin on interest rates, shrinking Bank profits. As a result, interest rates increase.
Another factor to upward pressure on near term fixed interest rates are Canadian Mortgage rule changes. The cost of funding a Mortgage, requiring lenders and Mortgage insurance companies to reserve more capital in case of a housing melt-down, is much higher. Similar to any commodity, the laws of supply and demand are at play here.
Variable Rate Update:
The Bank of Canada controls the movement of Bank Prime rates. The movement, up or down of the Bank of Canada’s key overnight lending rate, is typically based on the direction of core inflation. In the most recent “Monetary Policy Report” released from the Bank several weeks ago, Canada’s inflation metric is on target at 2%. I am on record saying, in previous client videos, I do not think this rate is moving up until late 2018.
Below is an fixed interest rate barometer:
Conclusion:
Thank you for reading!
Please continue to visit my blog for future Mortgage and Real Estate updates.
To gain access to my private client list, please let me know so I may add you. I publish information there not available on my blog.
Thank you and talk soon!
Chad Moore
P.S
If you are considering purchasing a home in the next 6-12 months consider my Mortgage and Real Estate team to help you accomplish your goals.
Recent Posts
Calgary Market Update—March 2025 Data
Here are some Calgary Real Estate numbers, across all property types, out of the gate for…
Interest Rates Up Or Down?
Hey Guys! Tariffs are here. Now what? Tiff Macklem, governor of the Bank of Canada, gave…
Bank of Canada Hot Mic Moment
Hey Guys! The Bank of Canada publishes "meeting deliberation notes" relating to the discussion of raising,…
Banker’s Damaging Admission
When the governor of the Bank of Canada speaks, we listen! Tiff Macklem, governor at…
January 2025 Market Stats
Let's look back at January 2025 Calgary Real Estate Board (CREB) data to make sense…
Mortgage Interest Rate Review
Hey Guys! Here's an example of how the Bank of Canada is in a balance…


