Here’s the final month of what’s been a rollercoaster year for values, listings and absorption rate. I honestly expect more of the same for 2018.
The intention of publishing this data month-over-month is to help you get a sense of the direction of near term Real Estate values and WHY they’re trending up, down or flat.
View this data from the understanding that Real Estate is a commodity based on supply and demand. That said, there definitely is an emotional side to Real Estate. Have you ever fallen in love with a home before? How about any purchase (shoes etc)?
The data below will help you understand the supply side of Calgary’s Real Estate market. Look for my other blog posts on the demand side of the equation. This would be jobs creation, migration of people and market sentiment.
I think this data is important for buyers and potential sellers to understand. Why? Well, making an offer at 2006 pricing might not be a good strategy. And listing a home based on 2014 pricing might not work either? Context is key.
Now, this is Calgary Metro data. Each of Calgary’s quadrants, areas, neighborhoods and price range will ebb and flow differently. If you’d like, I can connect with you a top quality Realtor to assist you further.
Let’s look at the data for single family detached housing and apartment dwellings in Calgary:
1. Sales To New Listing Ratio.
2. Absorption Rate.
3. Average/Median Price.
Single Family Detached Housing Data:
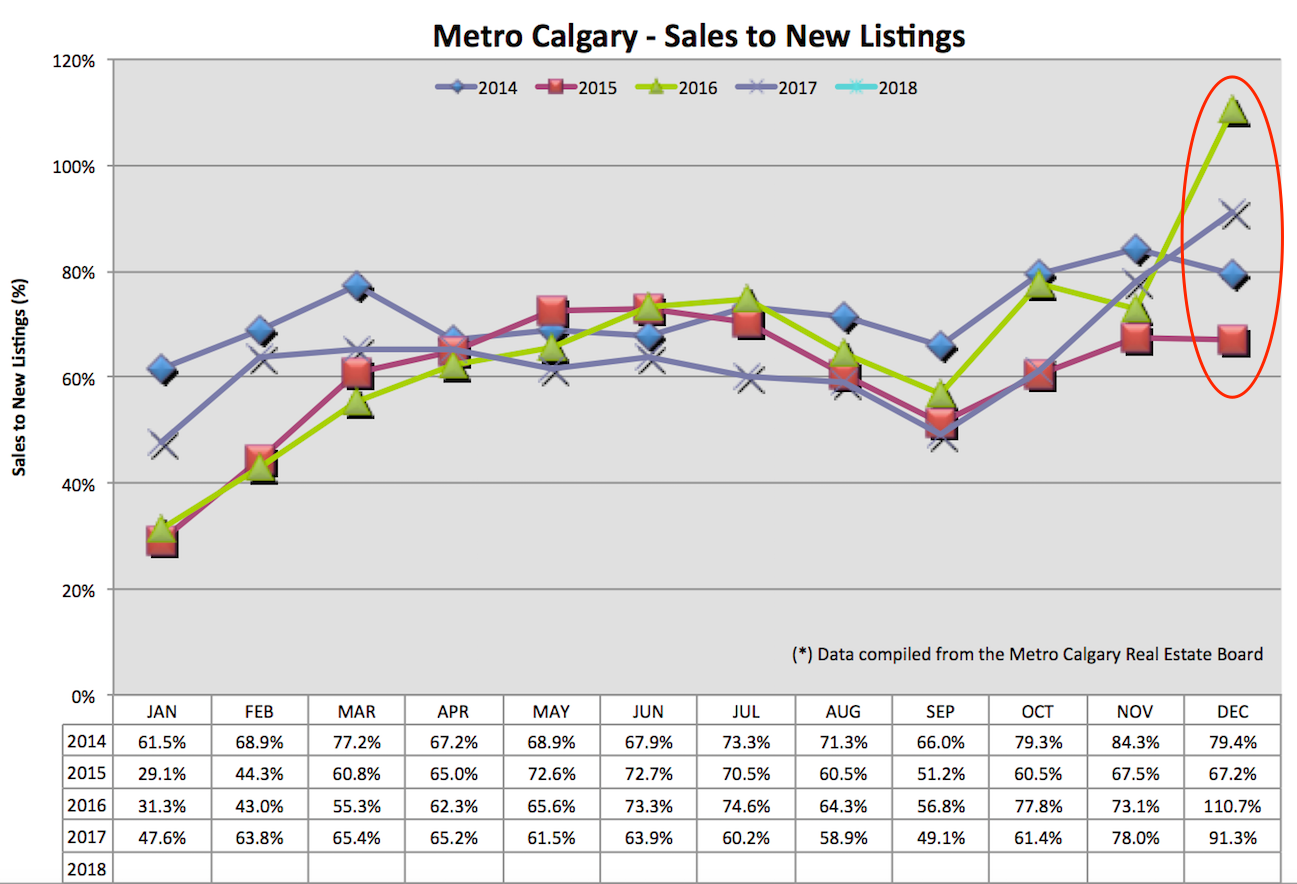
Sales To New Listings Ratio:
In general, an upward trending line indicates less future listing supply. A lower trending line indicates building inventory. The amount of inventory directly effects pricing. More inventory is down pressure on pricing. Less inventory is up pressure on pricing. In these isolated cases, demand would remain the same.
Similar to December 2016, December 2017 has a nice lift in percentage indicating less future inventory. This should buoy pricing.
I think this is an early indicator of a busy Spring 2018 market. Calgary experienced this Spring 2017 with increasing sales, decreasing inventory and rising prices.
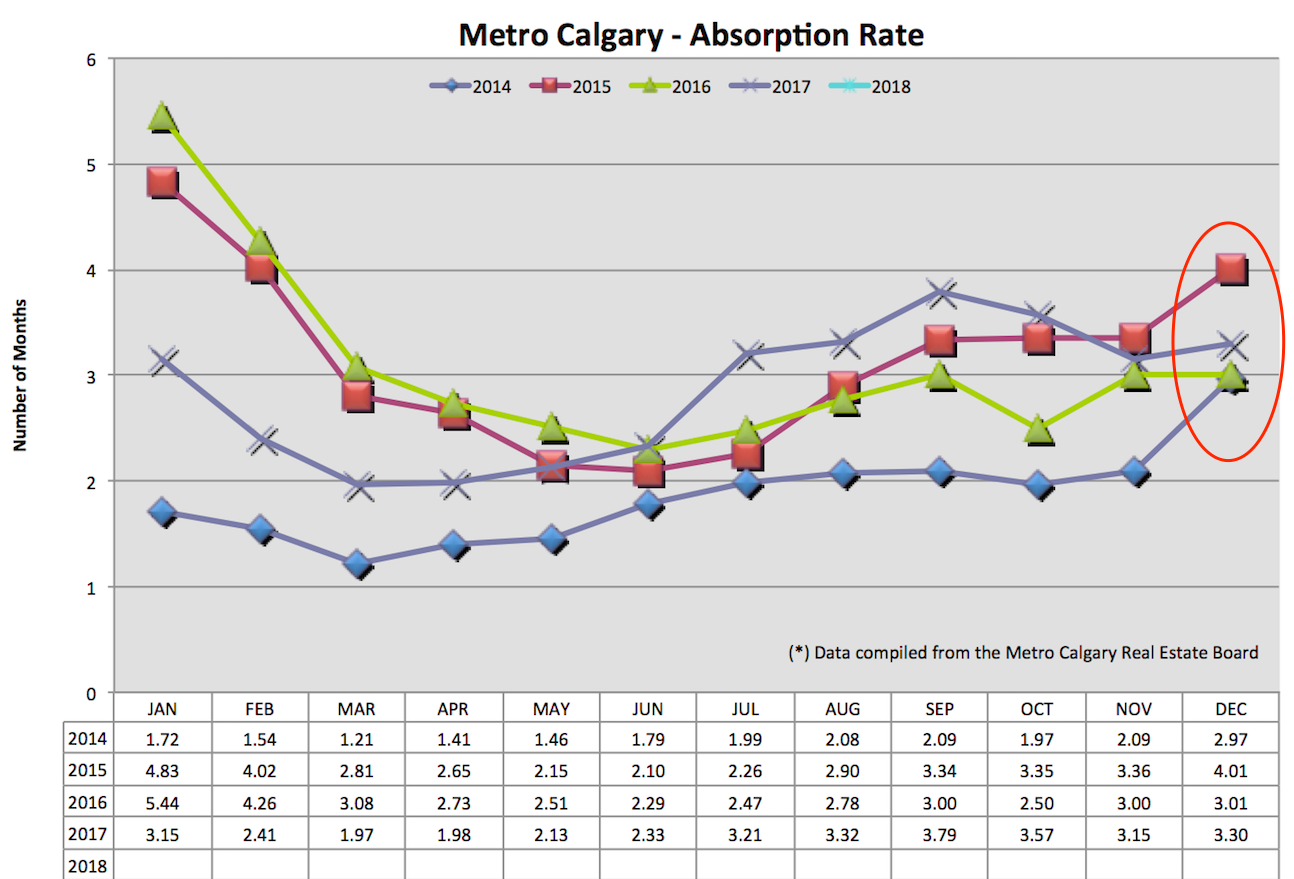
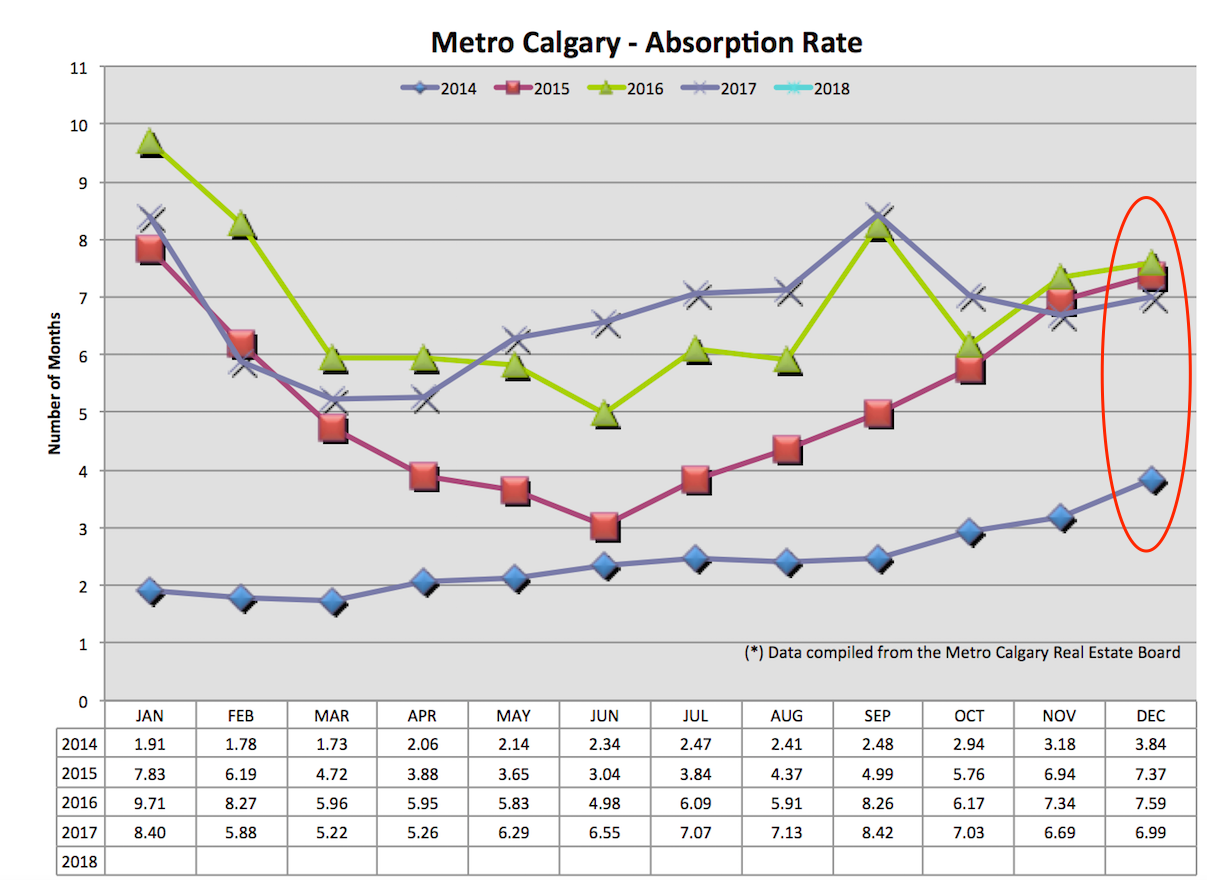
Absorption Rate:
Higher absorption rates indicate a buyers market because of higher inventory and or lower sales volume. Lower absorption rates indicate a sellers market because of increasing sales and lower inventory. In general, 2-4 months is a balanced market.
We can see Calgary’s absorption rate in at 3.30 months which is fairly well clustered with previous years data. I think this should again stabilize pricing moving forward.
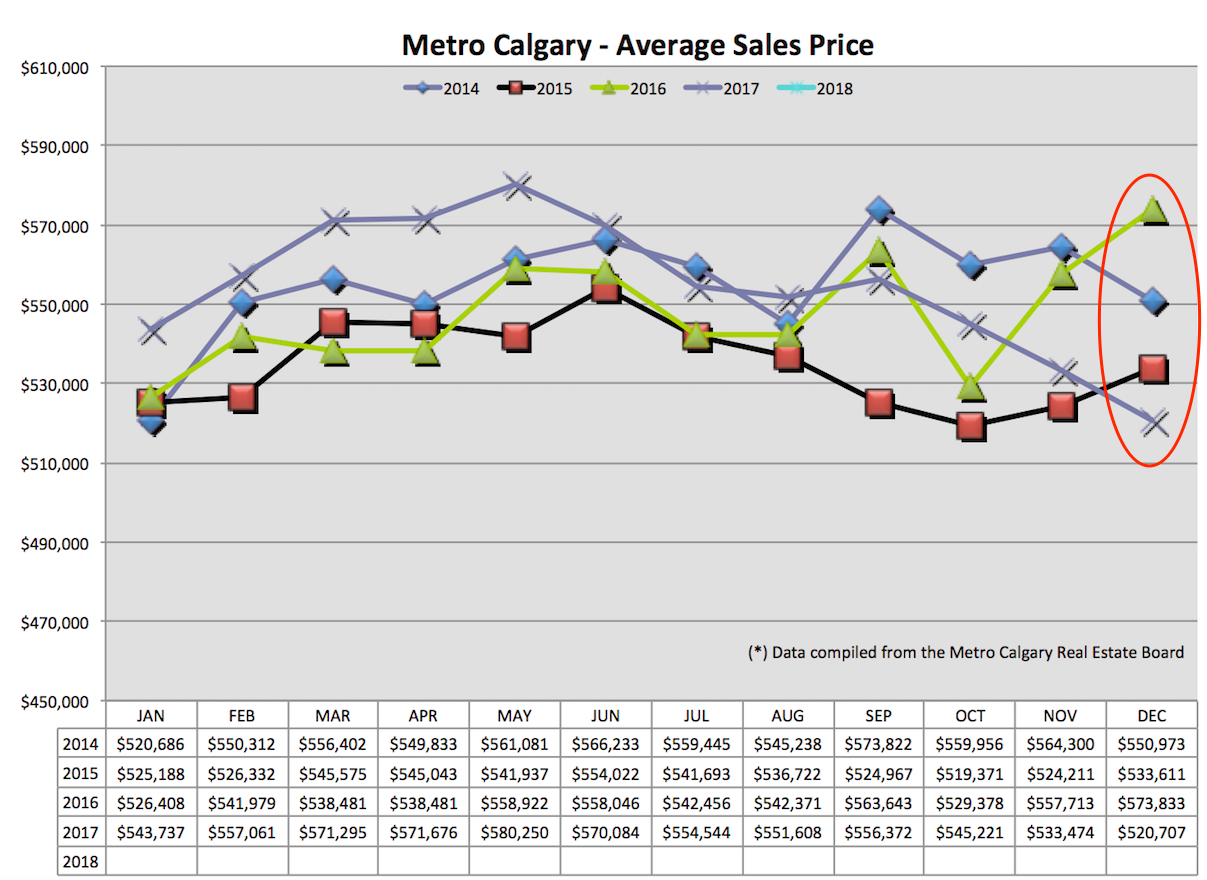
Average Price:
Average price is on a linear trajectory down at the moment. This is a result of previous months increasing absorption rate and slightly lower sales to new listings ratio.
In anticipation of the Mortgage rule changes, I think the market sentiment has been one of uncertainty. Regardless of fundamentals of supply/demand, market uncertainty creates down pressure on pricing. I think people are worried about home prices falling due to the Mortgage rule changes, which might be reflected in pricing now.
Another thought is there is more purchasing activity at lower price points as people enter the property ladder before the Mortgage rule change.
Apartment Data:
You might notice more volatility in the data below. This is due to smaller sample sizes of apartment data, relative to single family detached home data. Swings in numbers can happen but I think overall trend lines can be concluded.
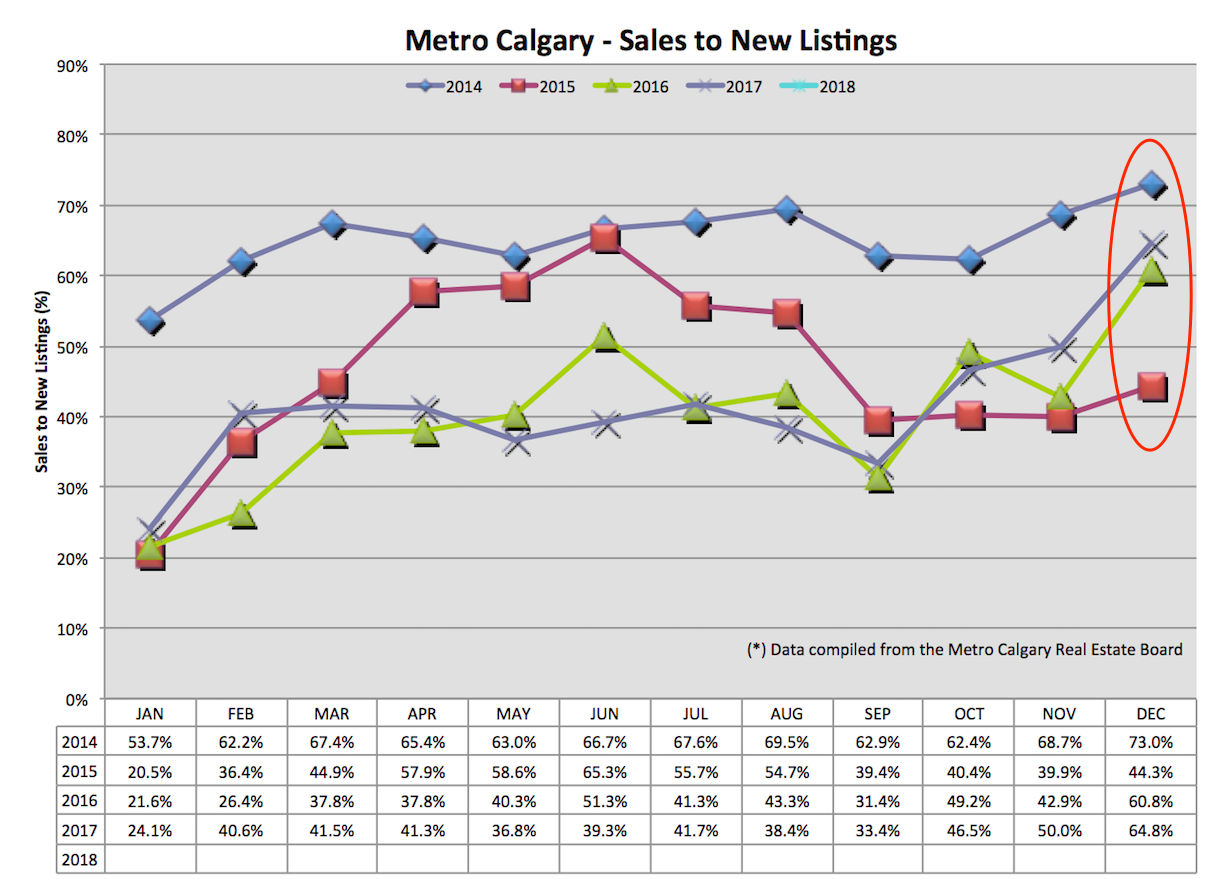
Sales To New Listings Ratio:
I see a positive trend in this data point. This indicates lower future apartment listings which should help begin to support near term price stability. We’re seeing an upward trend month-over-month and year over year.
Absorption Rate:
This data point is clustered very close together over the last three years. Relative to the 2014 Apartment market, this number is still very high. Look for this to trend down with a higher sales to new listings ratio above.
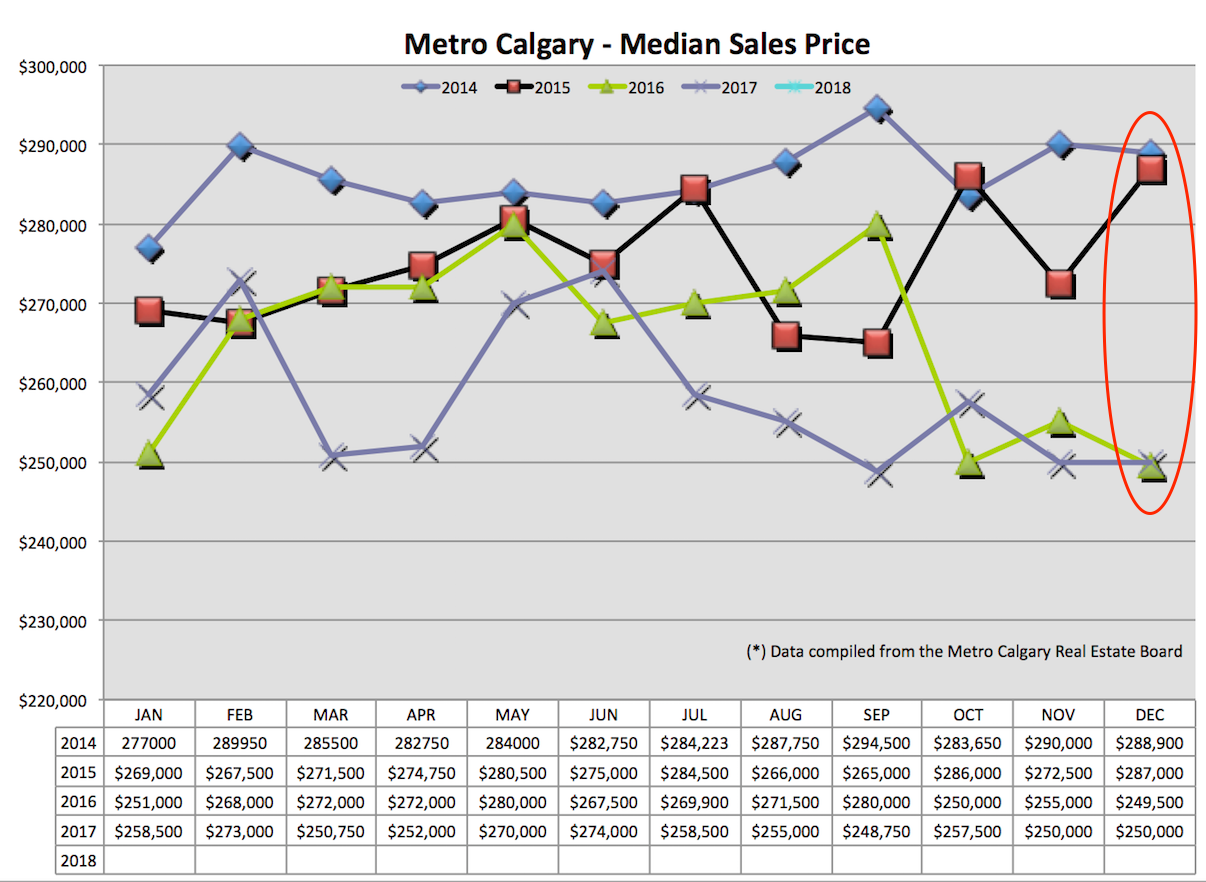
Median Price:
This data point is flat month-over-month and about the exact same year-over-year. Look for this to tend upward in the coming months.
 Conclusion:
With the activation of the new Mortgage rule changes, I think continuing to keep a close eye on supply will be a key factor in price direction.
The uncertainty of “what might happen” in-and-of-itself is enough to put down pressure on the market. Sometimes, this kind of collective thinking in the market presses prices down (or up in the opposite situation) beyond what fundamentals support for pricing.
What I’m saying …if prices decrease below the point of buyer fundamentals, that might be a good time to go against the grain and purchase a home while everyone is fearful/waiting to see what happens. Like always, the bottom of a cycle will not be known until well past it.
Would you like to get clear on your home affordability? If so, please connect with me here.
Facebook like and share this post please (click the thumb at the top).
Cheers,
Chad Moore